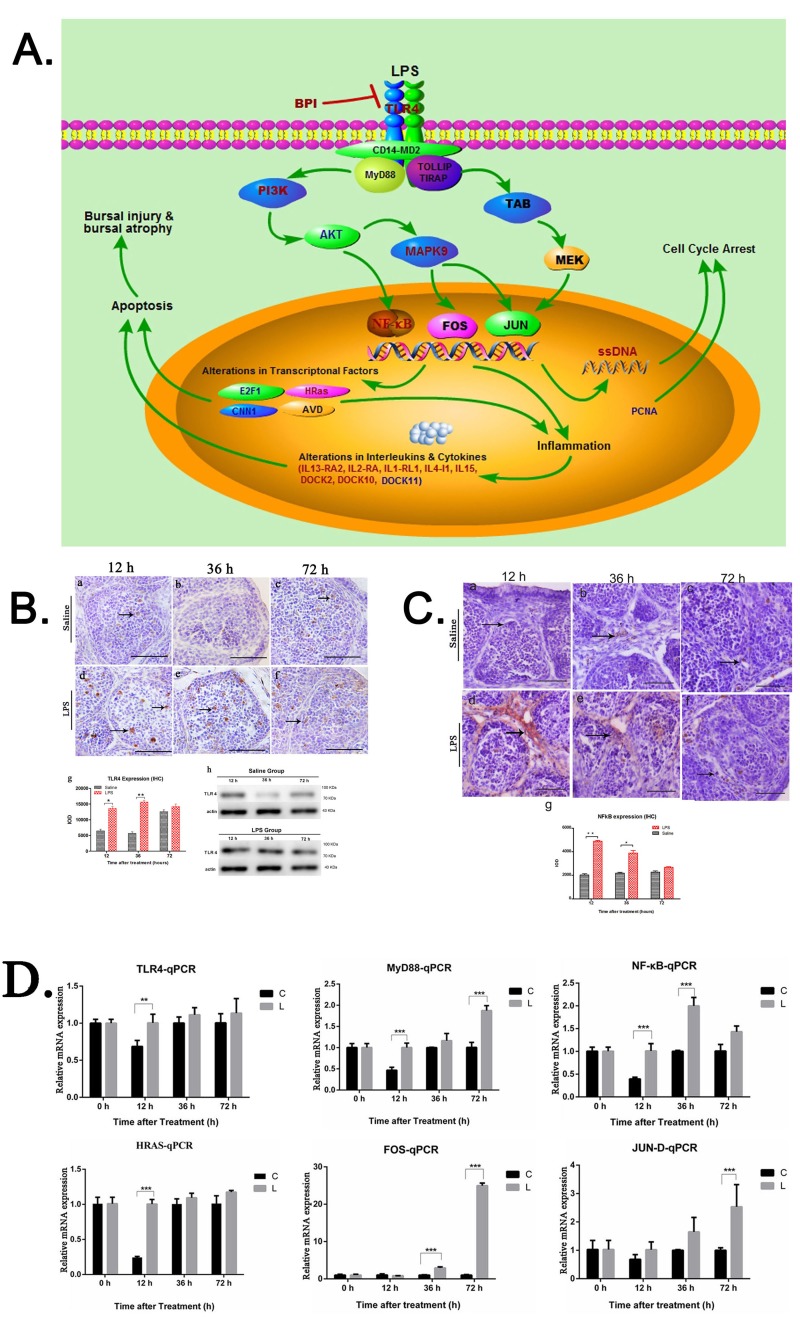
Figure 6. Functional pathway analysis and graphical illustration of molecular mechanism of LPS induced bursal atrophy.
A. Diagram showing TLR4-MAPK-NF-κB/AP-1 pathway analysis of differentially regulated genes in LPS-treated BF. The red colored text represents upregulated genes; blue designates downregulated genes and black designates neighboring genes in TLR4-MAPK-NF-κB/AP-1 pathway in chicken bursa of Fabricius at early time point. The figure was drawn in Pathway Builder Tool. 2 software. B. Representative images of immunostained BF sections from LPS and saline control group chicks using anti-TLR4 antibody at 12, 36 and 72 h time points. As seen, TLR4 expression is enhanced in the LPS treated BF compared to control. Integral optical density (IOD) shows increased TLR4 expression at 12 and 36 h after LPS treatment. Scale bars = 50μm. Note: * denotes P < 0.05; ** denotes P < 0.01. Data represent microscopic examination of at least five tissue sections per chick per group (n = 3 at each time point). Also shown are immunoblots showing increased TLR4 expression in LPS-treated BF compared to control. C. Representative images of immunostained BF sections from LPS and saline control group chicks using anti-NFkB-p50 antibody at 12, 36 and 72 h time points. IOD analysis shows increased NFkB expression at all 3 time points in LPS-treated BF (arrows) compared to control. Scale bars = 50μm. * denotes P < 0.05; ** denotes P < 0.01. Data represent microscopic examination of at least five tissue sections per chick per group (n = 3 at each time point). D. QRT-PCR analysis of TLR4, MyD88, NFκB, HRas, FOS and JUN-D mRNA expression at 12, 36 and 72 h post LPS treatment as validation of key components of TLR4-MAPK-NF-κB/AP-1 pathway.

