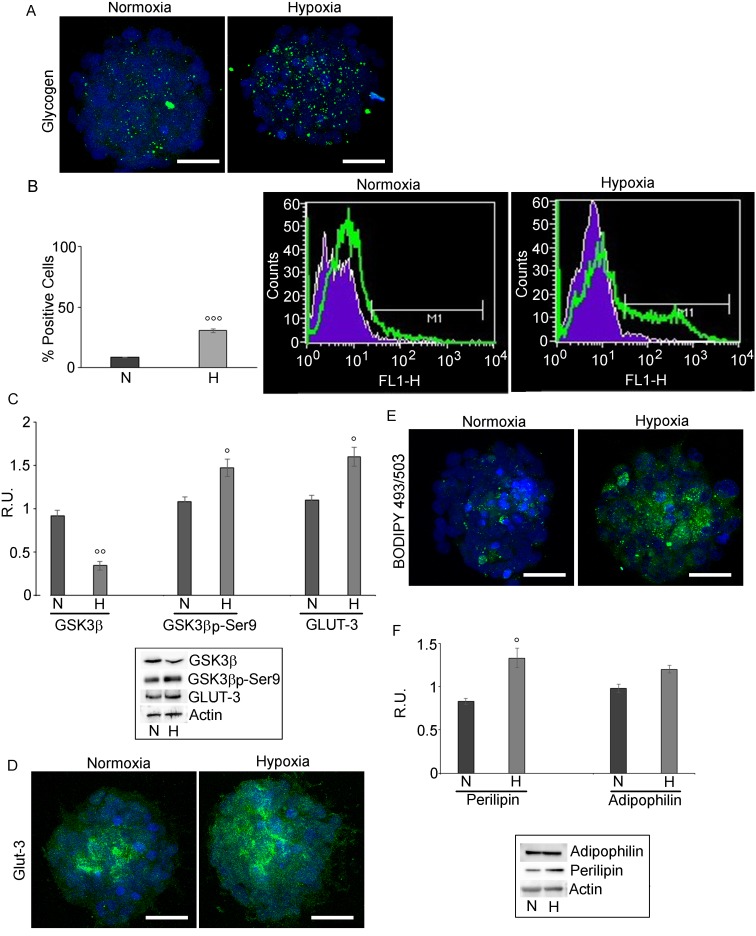
Figure 3. Glycogen and LD in GSCs evaluated by confocal microscopy and cytofluorimetry.
A. glycogen localization in normoxic and hypoxic GSCs shows that glycogen is highly present in hypoxic conditions . Nuclei are stained with Dapi. Bar = 25µm. B. Glycogen evaluation by FACS analysis confirmed the higher presence of glycogen in hypoxic neurospheres. Data are means ± SD of 3 different experiments. °°°, p < 0.0001 hypoxia vs normoxia. C. Western blotting analysis for GSK3β, p-GSK3β-ser9 and GLUT-3 shows a decrease of the active GSK3β paralleled by an increase of the inactive form p-GSK3β-ser9. GLUT-3 increases in hypoxia. Data are means ± SD of 3 different experiments. °, p < 0.01, °°, p < 0.001 hypoxia vs normoxia D. GLUT-3 immunofluorescence in normoxic and hypoxic GSCs confirmed the higher presence of GLUT-3 in hypoxic GSCs. Nuclei are stained with Dapi. Bar = 25µm. E. BODIPY 493/503 staining of LD in N and H conditions show the higher LD content in hypoxic neurospheres. Nuclei are stained with Dapi. Bar = 25µm. F. Western blotting analysis for perilipin and adipophilin in normoxic and hypoxic GSCs shows that perilipin is significantly increased in hypoxia, while adipophilin is not significantly modulated. Data are means ± SD of 3 different experiments. °, p < 0.01 hypoxia vs normoxia.

