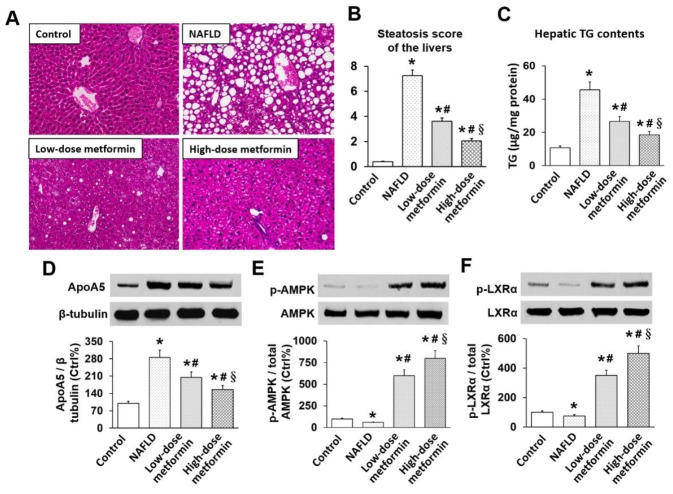
Figure 1. Effects of metformin on hepatic steatosis, TG, apoA5, and phosphorylation of AMPK and LXRα in mice.
(A) H&E histology of liver tissue (×400 magnification); (B) Hepatic steatosis score; (C) Hepatic TG level; (D) Hepatic apoA5 protein levels; (E) Hepatic AMPK phosphorylation; (F) Hepatic LXRα phosphorylation. * p < 0.05 vs. control; # p < 0.05 vs. NAFLD group; § p < 0.05 vs. low-dose metformin group.

