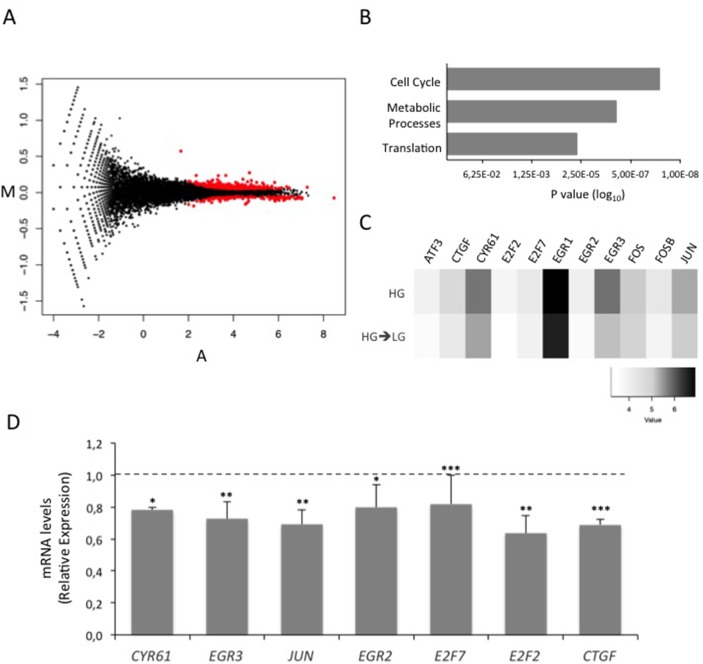
Figure 2. Effect of glucose on MCF7 cell transcriptome.
(A) Standard MA plot (M, log ratios and A, mean average) of normalized (upper quartile) RNA-Seq data for each RefSeq gene. The y-axis reports logFC (fold-change), the x-axis the average log intensity (A) for each gene (indicated as dots). Red dots indicate genes that differentially expressed (P≥0.8) in the HG vs HG->LG comparison. (B) Bar graph showing the most significant gene pathways enriched with DEGs after the shift of MCF7 cells from high glucose (25mM; HG) to low glucose (5.5mM; HG→LG). (C) Heatmap of log-transformed normalized gene expression values for a small subset of highly significant deregulated genes belonging to “Cell cycle” pathway. (D) MCF7 cells grown HG (dotted line) were shifted in LG (HG→LG) during the treatment with estradiol (100nM; E2). After four days, mRNA expression levels of “Cell cycle” DEGs were determined by qRealTime-PCR (see Methods and Table 1). Data were normalized on Hypoxanthine Guanine Phosphoribosyl Transferase (HPRT) gene as internal standard. Bars represent the mean ± SD of three independent triplicate experiments and show the mRNA levels of DEGs in HG→LG cells relative to those in HG cells. * denote statistically significant values (*p<0.05, **p<0.01, ***p<0.001). See also Supplementary Figure 1.

