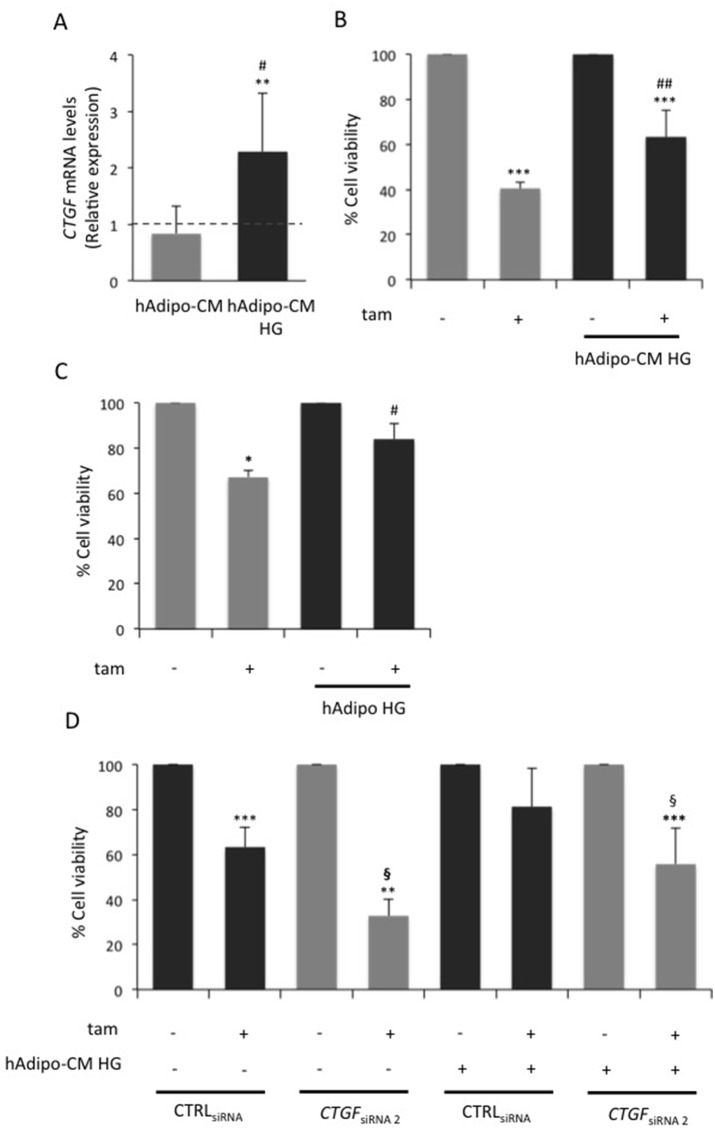
Figure 5. Role of CTGF in glucose-induced adipocyte-effect on MCF7 responsiveness to tamoxifen.
(A) Mature adipocytes, cultured in 15mM glucose, were incubated in serum free high glucose medium (25 mM; HG). After 8 hours, media were collected - from adipocytes pre-incubated or not in HG (hAdipo-CM and HG hAdipo-CM, respectively) - and applied onto MCF7 cells. As control, the cells were incubated in serum-free medium (15mM and 25mM, respectively). After four days, CTGF mRNA expression levels were determined by qRealTime-PCR, as described in Methods. Data were normalized on Hypoxanthine Guanine Phosphoribosyl Transferase (HPRT) gene as internal standard. Bars represent the mean ± SD of three independent triplicate experiments and show the expression levels of CTGF in cells treated with conditioned media relative to those in untreated cells (dotted line). * denote statistically significant values compared with positive control (**p<0.01); # denote statistically significant values compared with cells treated with hAdipo-CM (#p<0.05). (B) MCF7 cells were treated with estradiol (100nM; E2) and tamoxifen (5μM; tam) in presence of HG hAdipo-CM or in absence of it (in serum-free HG medium). As positive control, the cells were treated with E2 alone. After 4 days, cell viability was determined by sulforhodamine B assay, as described in Methods. (C) MCF7 cells were seeded in the upper chamber of a transwell system with or without mature adipocytes in the lower chamber. MCF7 cells were treated with E2 and tam (5μM) in serum free HG medium. As positive control, the cells were treated with E2 alone. After 24 hours, cell viability was assessed by crystal violet, as described in Methods. (D) MCF7 cells transfected (see Methods) with selected siRNAs recognizing CTGF (10nM; CTGFsiRNA 2) or with a control siRNA (10nM; CTRLsiRNA) were treated with E2 (100nM) and tam (5μM) in presence or absence of HG hAdipo-CM. As positive control, the cells were treated with E2 alone. After 24 hours, cell viability was assessed by sulforhodamine B assay, as described in Methods. For the panels (B), (C) and (D), the results were reported as percentage of viable cells compared with positive control, considered as 100% viable cells. Data represent the mean ± SD of three independent triplicate experiments. * denote statistically significant values compared with positive control (*p<0.05; ***p<0.001); # denote statistically significant values compared with tam treatment in absence of (B) hAdipo-CM, (C) adipocytes (#p<0.05; ##p<0.01); § denote statistically significant values compared with tam treatment in CTRLsiRNA cells (§p<0.05).

