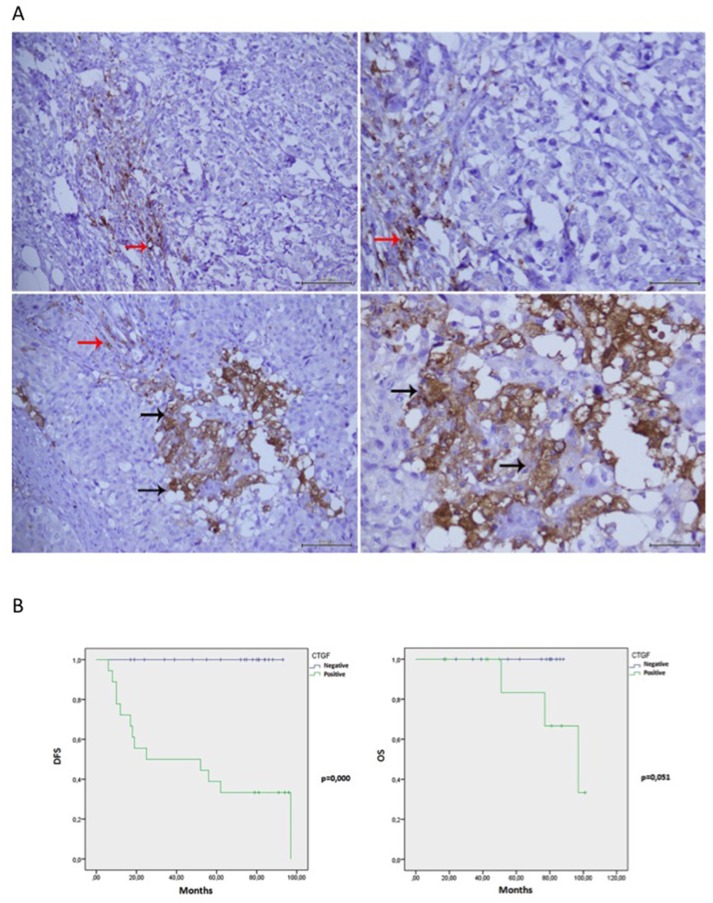
Figure 7. CTGF IHC staining in ER+ breast cancer tissues and Kaplan-Meier curves.
(A) Negative staining of CTGF in cancer cells at 20x and 40x magnification (Upper panels, respectively). Positive staining of CTGF in cancer cells (black arrows) at 20x and 40x magnification (Lower panels, respectively). Details of inflammatory cells CTGF staining (red arrows) represented positive internal control. (B) Kaplan-Meier curves representing overall survival (OS) and disease-free survival (DFS), have been calculated as described in Experimental Procedures. The follow-up duration was five years. Patients which stained positive for CTGF were reported as Green line; patients which stained negative as blue line.

