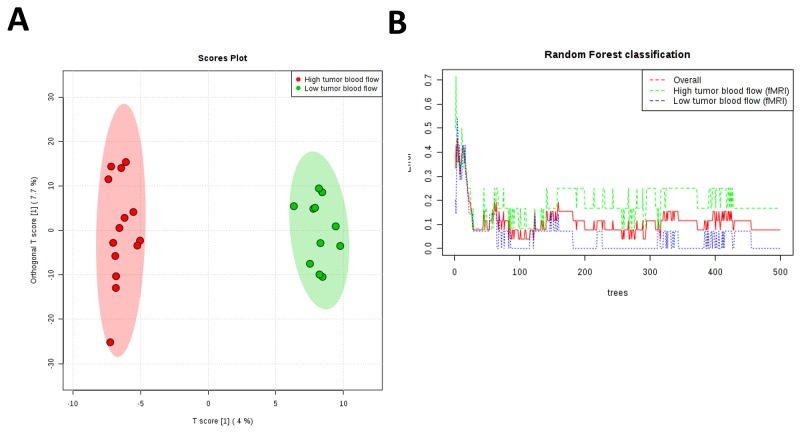
Figure 2.
(A) Ortho-PLSDA algorithm using all metabolites found in samples from endometrial cancer tumours is able to discriminate groups with an observed Q2 of 0. 656 and observed R2Y of 0.985. Red spots represent high tumour blood flow patients and green spots represent low tumour blood flow as determined by DCE- MRI. (B) RF classification shows and overall classification error of 0.07.

