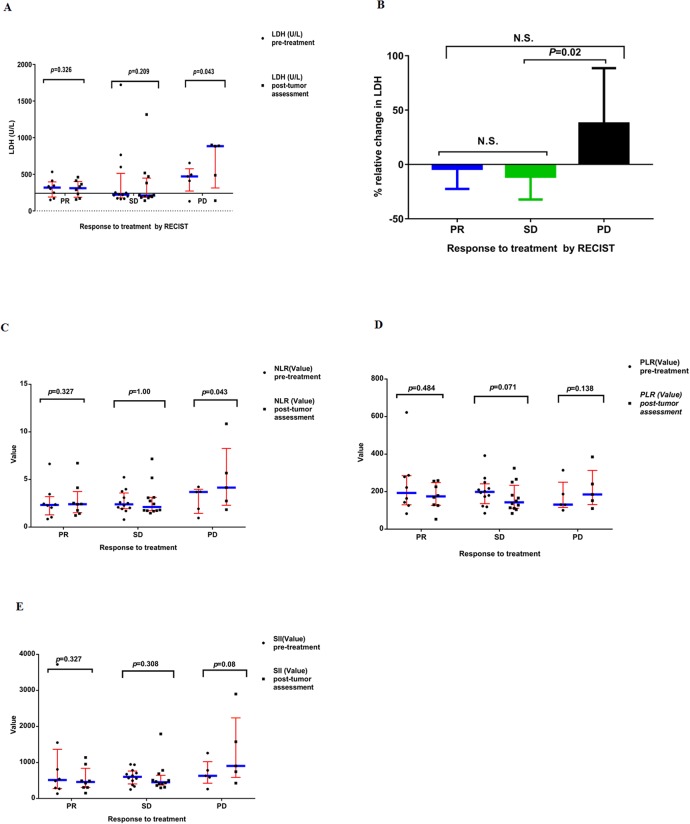
Figure 2.
(A) Serum levels of LDH pre-treatments and post-tumor assessment in the all patients enrolled on study. Results are divided in six dot plots, representative of the levels of LDH pre-treatments versus post-tumor assessment in patients who showed PR, SD and PD. P values are the result of the nonparametric Wilcoxon Signed Rank test. The horizontal line of X axis represents the upper limit of normal (ULN) value of LDH. (B) The relative changes in the value of LDH pre-treatments versus post-tumor assessment in patients with colorectal cancer. Results are divided in three histograms, representative of the relative change of LDH in patients who showed PR, SD and PD. Values are the median (interquartile range). Nonparametric Kruskal–Wallis test was used to determine statistical difference between groups. (C) The value of NLR pre-treatments and post-tumor assessment in the all patients enrolled on study. Results are divided in six dot plots, representative of the value of NLR pre-treatments versus post-tumor assessment in patients who showed PR, SD and PD. P values are the result of the nonparametric Wilcoxon Signed Rank test. (D) The value of PLR pre-treatments and post-tumor assessment in the all patients enrolled on study. Results are divided in six dot plots, representative of the value of PLR pre-treatments versus post-tumor assessment in patients who showed PR, SD and PD. P values are the result of the nonparametric Wilcoxon Signed Rank test. (E) The value of SII pre-treatments and post-tumor assessment in the all patients enrolled on study. Results are divided in six dot plots, representative of the value of SII pre-treatments versus post-tumor assessment in patients who showed PR, SD and PD. P values are the result of the nonparametric Wilcoxon Signed Rank test. In all dot plots, the median and interquartile range are shown. LDH, lactate dehydrogenase; RECIST, Response Evaluation Criteria in Solid Tumors; PR, partial response; SD, stable disease; PD, progressive disease. NLR, neutrophil-to-lymphocyte ratio; PLR, platelet-lymphocyte ratio; SII, systemic immune-inflammation index; RECIST, Response Evaluation Criteria in Solid Tumors. P values<0.05 are considered as statistically significant. N.S.: non-significant.

