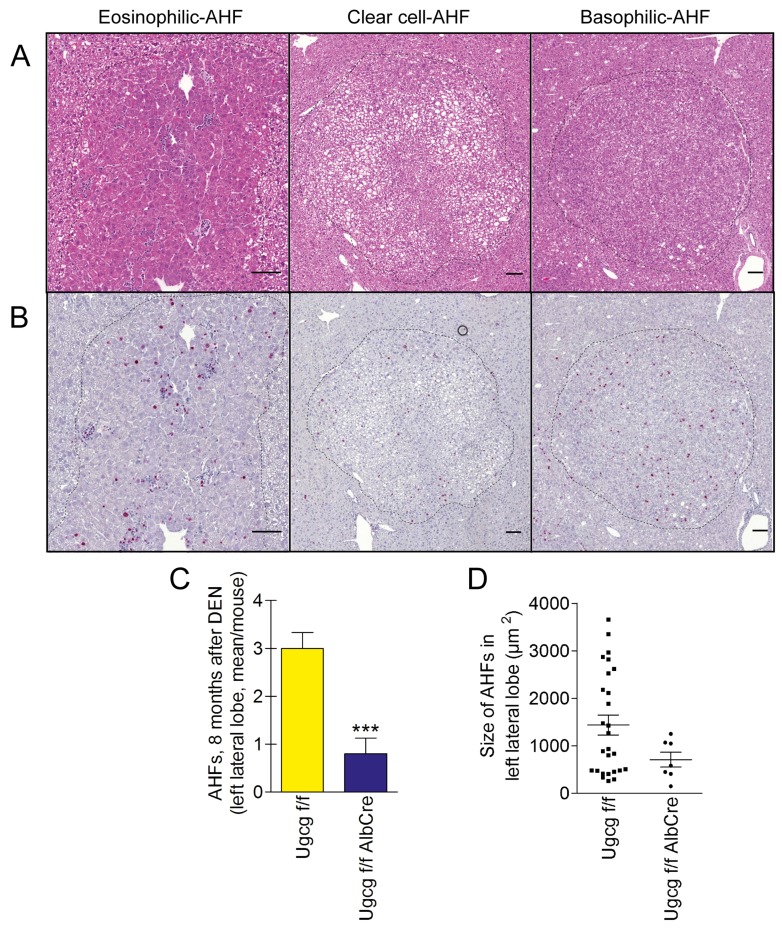
Figure 3. Number and area of dysplastic hepatocellular foci (AHFs) is reduced in Ugcg-deficient liver upon DEN treatment.
(A and B), H&E staining (A) and Ki67 staining (B) of dysplastic foci; scale bars, 100µm. (C), significantly decreased number of AHFs was seen in mutant as compared to control livers. (D), the area of AHFs in cross sections of the left lateral lobe was smaller in Ugcg-deficient liver than in control liver (summary of all detected foci; note, differences were not significant (p<0.09) due to the high standard deviation in control group). Ugcgf/f controls n=10 and Ugcgf/fAlbCre n=9, males. Graphs show mean values ± SEM. Significance, ***, p < 0.001 using student’s two-tailed t-test.

