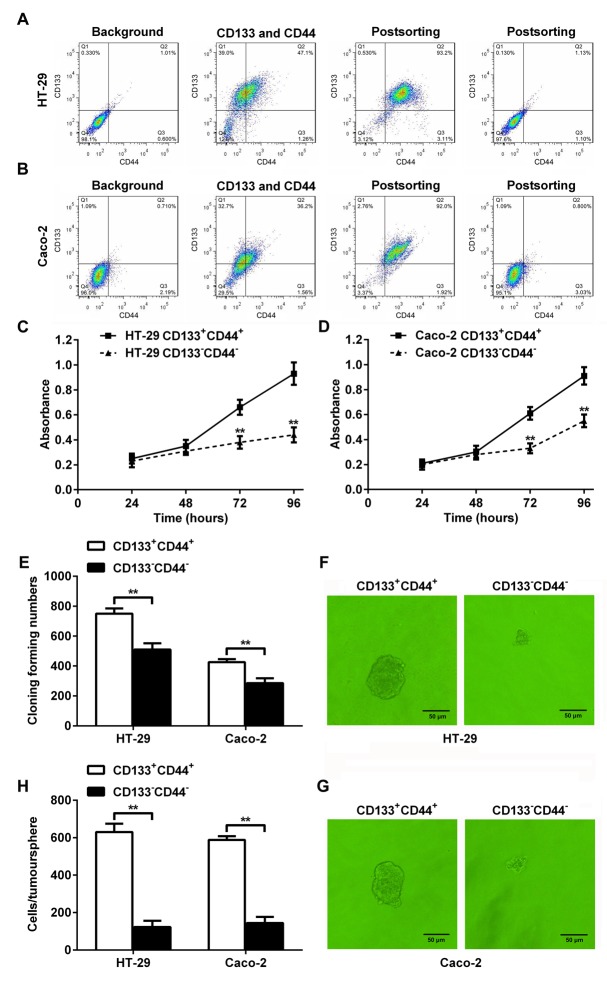
Figure 1. Characterization of CD133+CD44+ and CD133-CD44- CRC cells.
(A and B) Fluorescence-activated cell sorting and flow cytometry. CRC cells HT-29 (A) and Caco-2 (B) were separated into CD133+CD44+ and CD133-CD44- CRC cell population. (C and D) The proliferation rates of CD133+CD44+ and CD133-CD44- HT-29 (C) or Caco-2 (D) cells from days 1 through 4 after seeding (**: P<0.01). (E) The colony formation assay indicated that more colonies were formed in the CD133+CD44+ CRC cell population than in the CD133-CD44- CRC cell population (**: P<0.01). (F and G) Tumorsphere formation of CD133+CD44+ or CD133-CD44- CRC cell population from HT-29 (F) or Caco-2 (G) cells. (H) The cell numbers per tumorsphere in CD133+CD44+ and CD133-CD44- HT-29 or Caco-2 cells (**: P<0.01).

