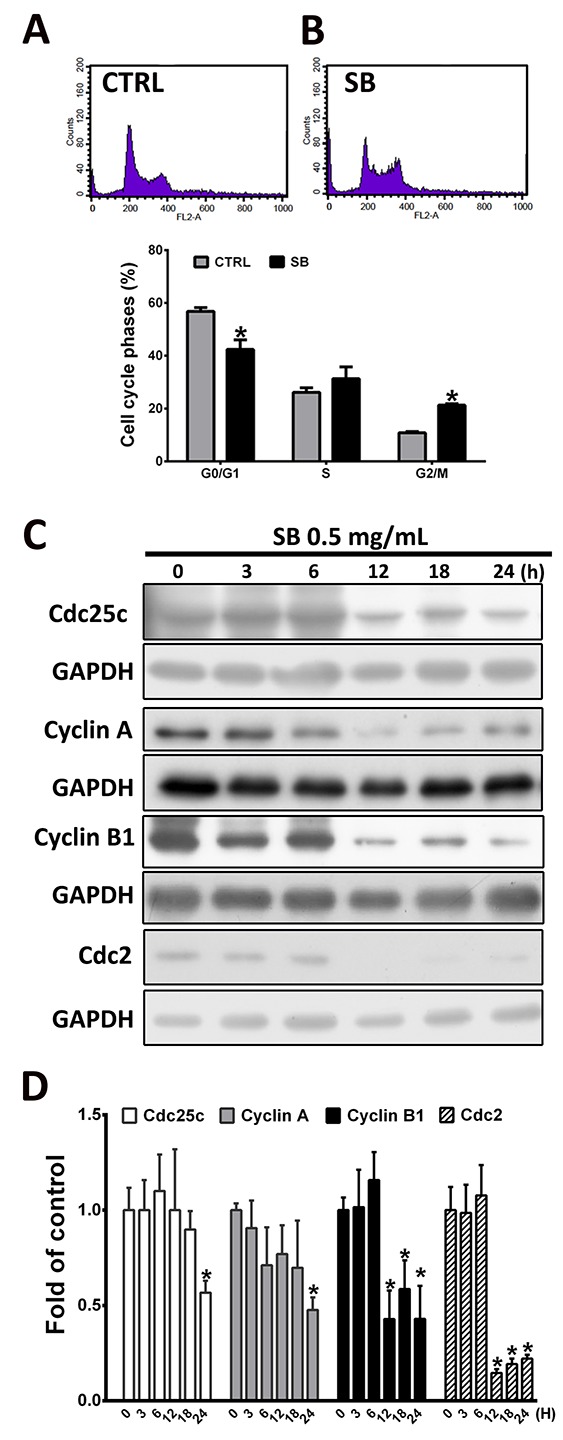
Figure 2. SB induces CL1-5 cell arrest in the G2/M phase.

(A-B) CL1-5 cells were treated with 0.5 mg/ml SB for 24 h, and the cell cycle distribution was determined by flow cytometry. (C) Western blot analysis of G2/M transition-related proteins after 0.5 mg/ml SB treatment of CL1-5 cells for different times. (D) Quantification of the western blot analysis. Data are represented as the mean±SEM. N=4-6. *P<0.05 vs. the untreated group (CTRL).
