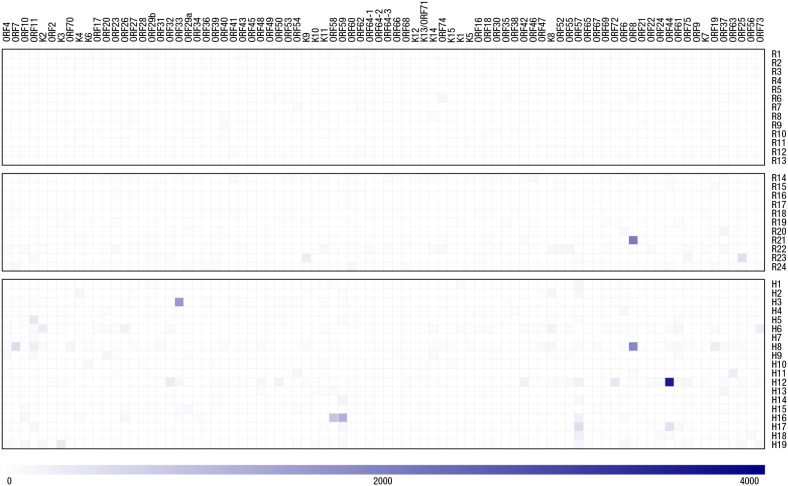
Figure 1. Summary of IFN-γ ELISpot responses to the KSHV proteome.
A heat map plot of IFN-γ ELISpot responses detected by our KSHV proteome analysis is presented with ORF pools examined in indicated in columns and donor codes identified in rows. Responses are denoted by blue-coloured squares with the intensity of each response proportional to the intensity of its corresponding square. A reference intensity scale is proved below the heat map.

