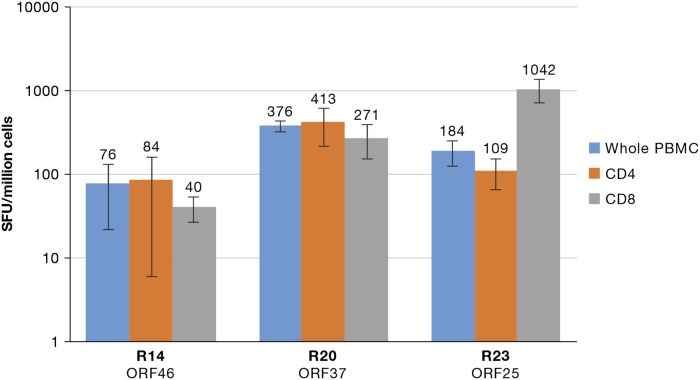
Figure 2. Presence of CD4+ and CD8+ specific IFN-γ ELISpot T-cell responses.
A graph of IFN-γ responses obtained by CD8+ and CD4+ sorting followed by type-specific ELISpot assay from three healthy donors is presented. The number of spots is presented on they-axis and the donors and respective ORF pools under the x-axis.

