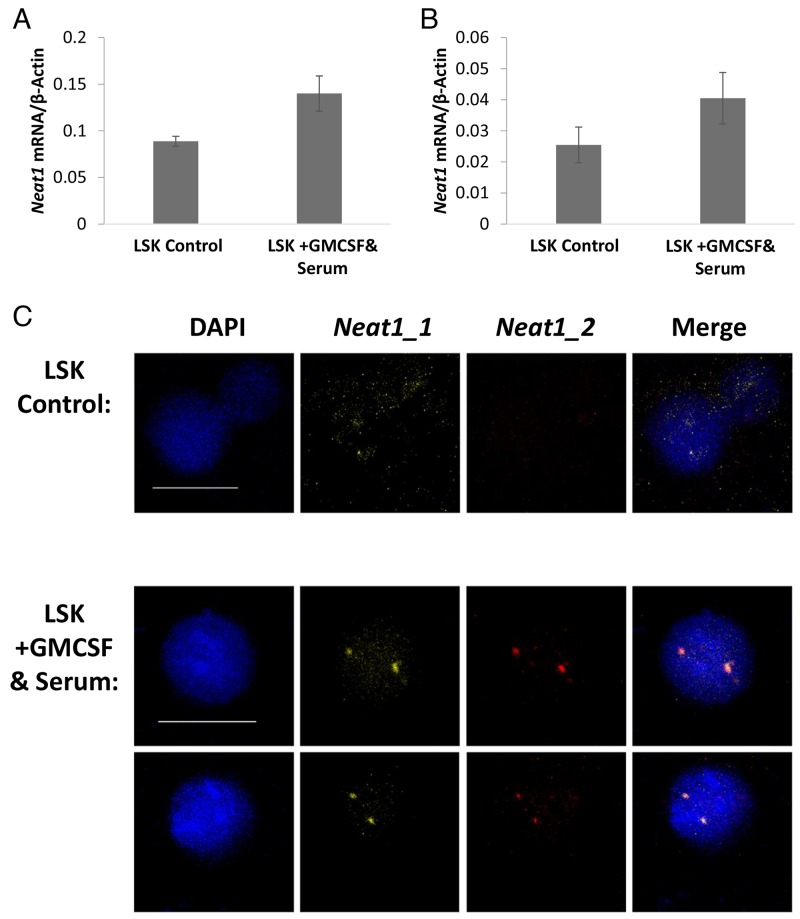
Figure 4. Neat1 expression is enhanced by differentiation in vitro.
(A and B) Expression levels of Neat1_1 and Neat1_2 measured by RT-qPCR and shown relative to β-Actin. GMCSF and Serum were added to the medium for the last 96 hours of the culture. Histograms show averages ±SD. (C) Confocal microscopy FISH of Neat1_1 and Neat1_2. Scale bar denotes 10 μ.m.

