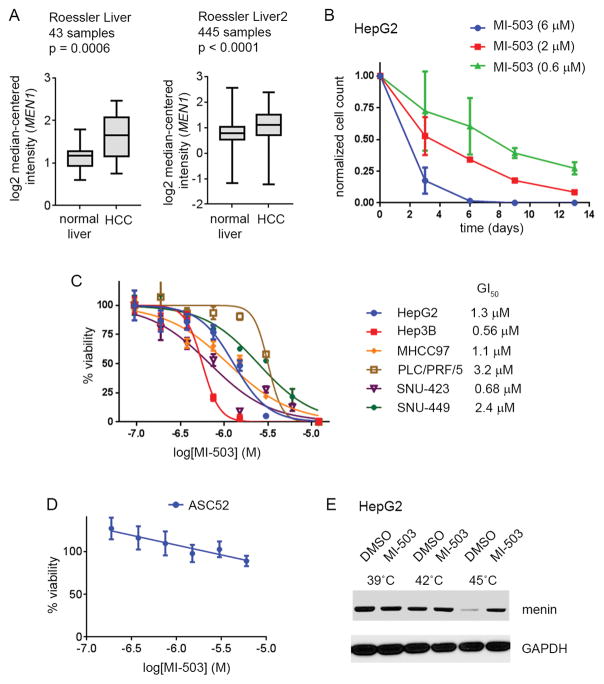
Figure 1. Effect of MI-503 menin-MLL inhibitor on HCC cell lines growth.
A. MEN1 expression in normal versus tumor liver cells based on the analysis of the Oncomine datasets (30). B. Growth curves demonstrating the effect of MI-503 on cell growth in HepG2 cells. Viable cells were counted at days: 3, 6, 9, 13. Data are normalized to DMSO treated cells and represent mean of duplicates ± SD. C. MTT cell viability assay performed in HCC cell lines after 12 days of treatment with MI-503. Data are normalized to the DMSO treated cells and represent mean of quadruplicates ± SD. D. MTT cell viability assay performed for MI-503 in normal adipose-derived mesenchymal stem cells, ASC52. Data are normalized to the DMSO treated cells and represent mean of quadruplicates ± SD. E. Results from the Cellular Thermal Shift Assay (CETSA) performed in HepG2 cells. Detection of menin and GAPDH is shown on the SDS-PAGE gel. MI-503 was used at 2 μM.

