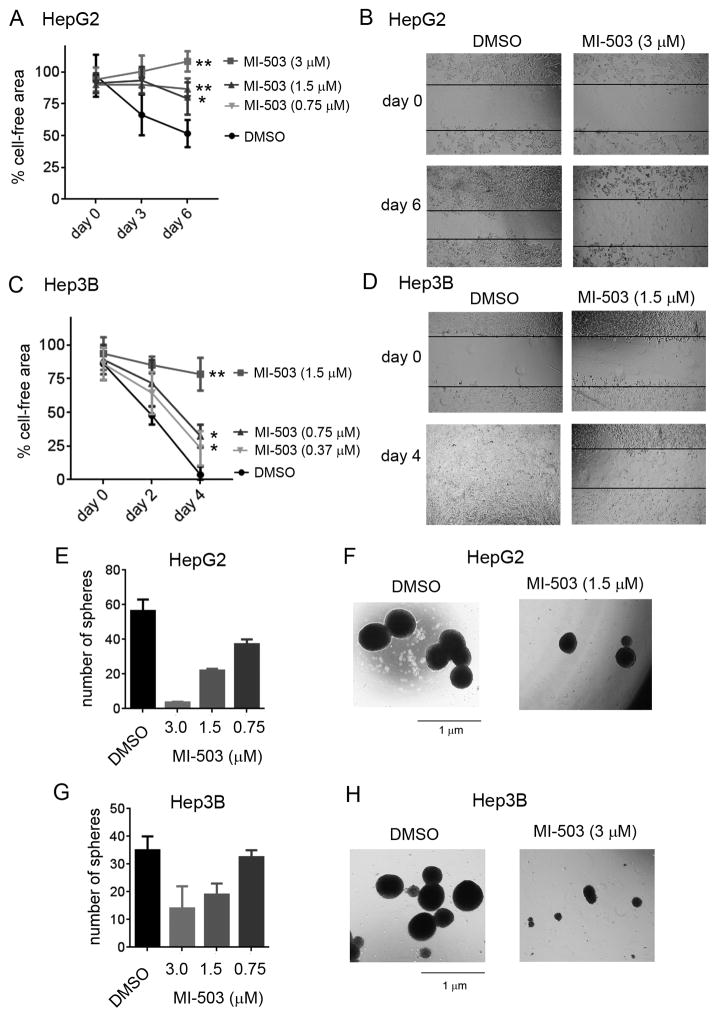
Figure 2. MI-503 blocks sphere formation and cell migration in HCC cell lines.
A–D. Inhibition of cell migration in HepG2 (A, B) and Hep3B (C, D) cells upon treatment with MI-503 measured by the wound closure assay. Data in panels A and C represent mean of duplicates ± SD. * indicates p < 0.05, ** indicates p < 0.01. E, G. Quantification of spheres in the sphere formation assay performed in HepG2 (E) and Hep3B (G) cells upon 14 days of treatment with MI-503 and DMSO. Data represent mean of duplicates ± SD. F, H. Pictures of spheres upon treatment of HepG2 (F) and Hep3B (H) cells with MI-503 or DMSO.

