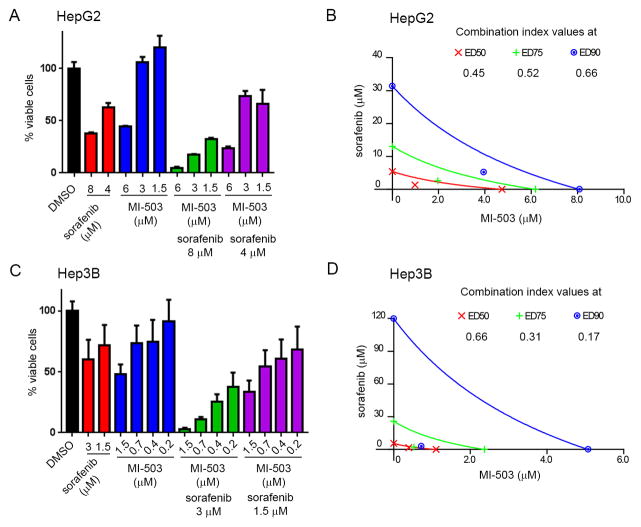
Figure 5. Sorafenib sensitized HCC cells to the treatment with MI-503.
A. MTT cell viability assay performed after 4 days of treatment of HepG2 cells with MI-503, sorafenib and both agents tested simultaneously. Data represent mean of quadruplicates ± SD. B. Isobologram obtained from analysis of the combination of MI-503 and sorafenib in HepG2 cells after 4 days of treatment. Combinatorial indices (CI < 1) indicate synergistic effect between these two agents in HepG2 cells. C. MTT cell viability assay performed after 5 days of treatment of Hep3B cells with MI-503, sorafenib or both agents tested simultaneously. Data represent mean of quadruplicates ± SD. D. Isobologram obtained from analysis of the combination of MI-503 and sorafenib in Hep3B cells after 5 days of treatment. Combinatorial indices (CI < 1) indicate synergistic effect between these two agents in Hep3B cells.

