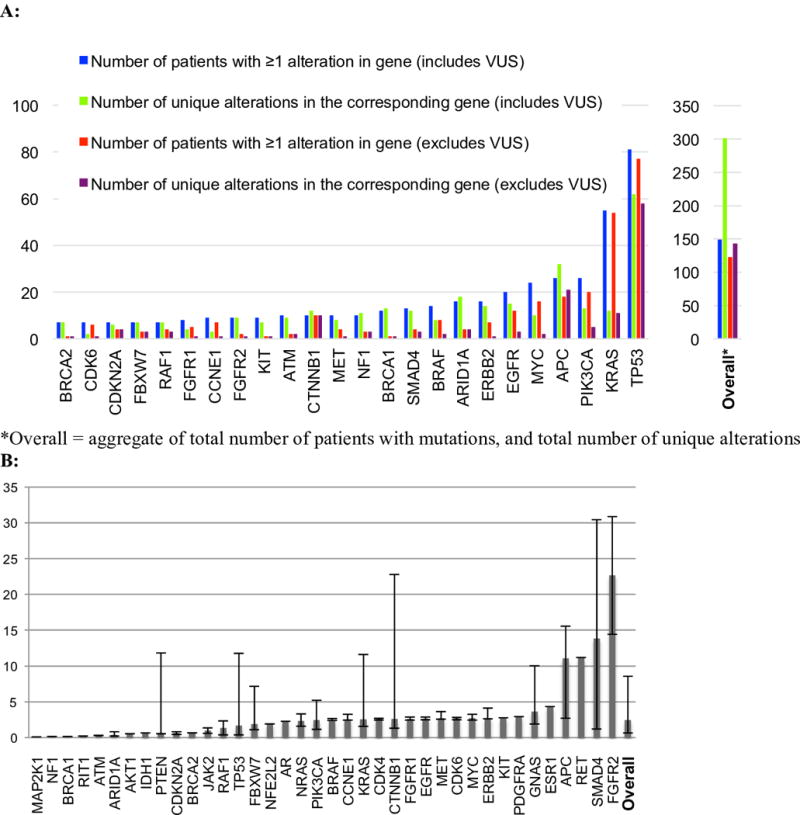
Figure 1. Most frequently altered genes and percent ctDNA by gene.

Abbreviations: VUS = variant of unknown significance
A: Bar plot representing the number of patients with an alteration(s) in a given gene, and the number of unique alterations in each gene. Unique alterations are defined as the number of specific alterations (point mutation, amplification, etc.) occurring in a given gene across the population. This plot only includes genes for which there were >5 patients with an alteration in the given gene; for others, refer to Figure S1. B: Bar plot representing median percent ctDNA (see Methods for definition) and 1st and 3rd quartiles. Only patients who had a characterized alteration in the specified gene were included in the calculation. Variants of unknown significance were excluded. In patients who had multiple tests that detected the same alteration, only the greatest value was included.
