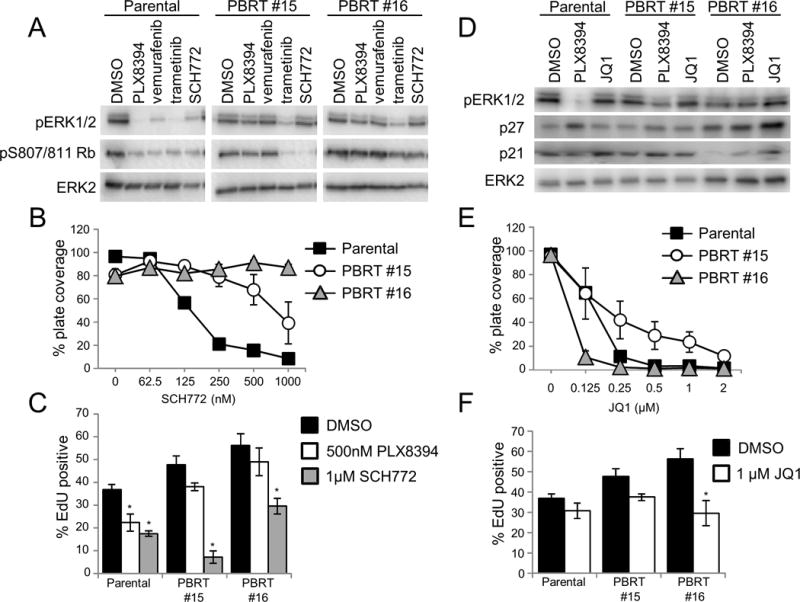
Figure 6. PBRTs have differential responses to second-line therapies.

A. 1205LuTR GAL4-ELK1, PBRT #15, and PBRT #16 were seeded in 6 well plates overnight then cells were washed and media was replaced and supplemented with DMSO, 0.5 μM PLX8394, 1 μM vemurafenib, 50 nM trametinib, or 1 μM SCH772. After 24hours, lysates were harvested and samples were analyzed by western blot. B. Quantification of crystal violet 2D growth assays for 1205LuTR GAL4-ELK1, PBRT #15 and PBRT #16 in the presence of increasing SCH772. Data points represent the average percent plate coverage of at least three independent experiments. Error bars are SEM. C. S-phase entry of 1205LuTR GAL4-ELK1, PBRT #15 and PBRT #16 cells were assayed by EdU incorporation. Graph is the average EdU positivity from at least three experimental replicates. Error bars are SEM, * indicates p value < 0.05 compared to each cell line’s DMSO condition using a two-way student’s T-test assuming unequal variance. D. Western blot analysis of 1205LuTR GAL4-ELK1, PBRT #15 and PBRT #16 cells after 24 hour drug treatment of DMSO, 0.5 μM PLX8394, or 1 μM JQ1. E–F. Similar to B-C except cells were treated with JQ1.
