
Figure 4. H&E stained sections of tumors exposed in vivo to vehicle (VC) or JQ1 demonstrate JQ1-induced changes in histology.
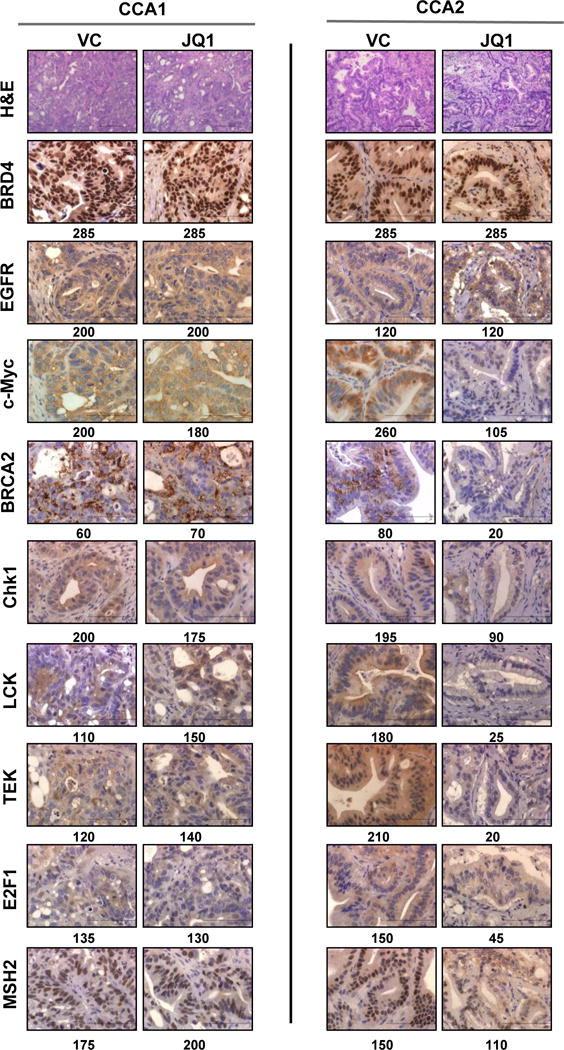
JQ1 downregulated c-Myc, BRCA2, Chk1, LCK, TEK, E2F1, and MSH2 protein expression in CCA2 tumors, but not in CCA1 tumors. JQ1 did not inhibit BRD4 or EGFR expression in either tumor model. Total expression index values are shown below each image. Scale bar = 20μm (H&E) or 10μM (all others). Expression indices for BRD4, EGFR, c-Myc, BRCA2, Chk1, LCK, TEK, E2F1, and MSH2 were calculated as described in Materials and Methods and are shown in Table S4.