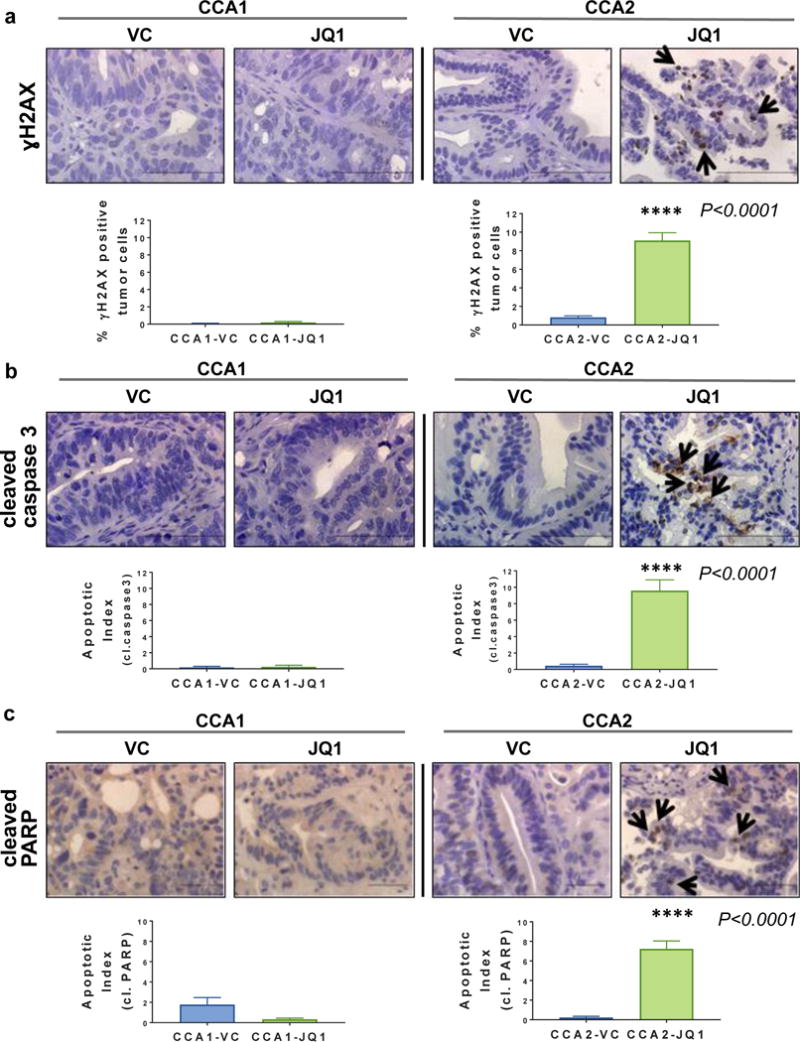
Figure 5. JQ1 induced DNA damage and apoptosis in CCA2 PDX tumors in vivo.

(a) Tissue sections were immunostained to detect ɣH2AX as an indicator of DNA damage or (b) cleaved caspase 3 or (c) cleaved PARP as an indicator of apoptosis, each of which is involved in DNA damage response. VC = vehicle control. Scale bar = 10μm. Quantitation of γ-H2AX immunostaining comparing data from CCA1 vs CCA2 tumors is shown in graphs below images. Apoptotic Indices were calculated by counting the number of apoptotic cells per total number of tumor cells (50) and shown as graphs. ****P<0.0001
