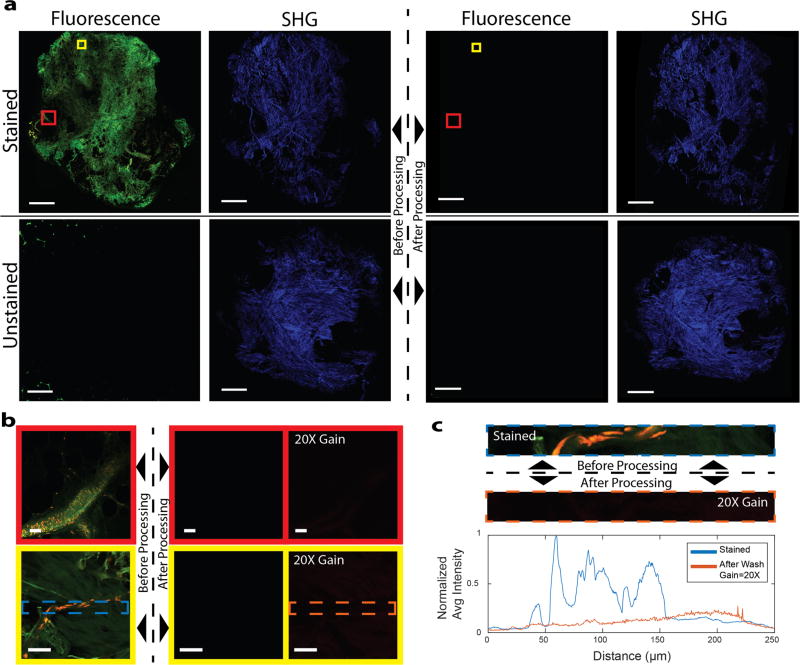
Fig. 6.
AO and SR101 are washed out to undetectable levels after standard tissue processing. (a) NLM fluorescent and SHG images before (first and second column) and after (third and fourth column) fixation and standard tissue processing of stained and unstained tissue. (Scale bars: 0.5 mm). (b) High magnification fluorescent images of select areas of (a) before processing (left), after processing (center), and after processing with 20 times the detector gain (right) (scalebars: 50 µm) (c) A representative plot of the normalized average intensity of the AO channel from a frame in (b) before processing and after processing at 20X detector gain. The spikes in the ‘stained’ tissue correspond to fluorescence emitted from AO in nuclei. There are no corresponding spikes in the ‘after wash’ graph and instead, there is a uniform background fluorescent signal present.

