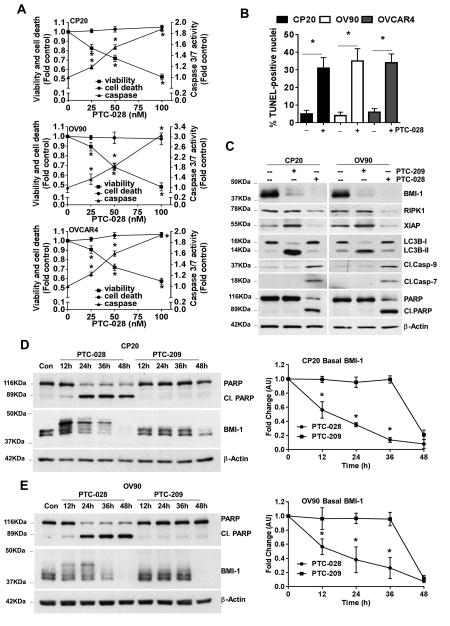
Figure 3. PTC-028 induces caspase-dependent apoptosis.
(A) CP20, OV90 and OVCAR4 cells were treated with increasing concentrations of PTC-028 for 48h and cell viability, cytotoxic cell death and caspase 3/7 activity was evaluated using the ApoTox-Glo Triplex assay. Data are mean ± S.D. of three independent experiments performed in triplicate. *P<0.05 when comparing with respective vehicle treated control by a two-way ANOVA. (B) CP20, OV90 and OVCAR4 cells were treated with 100 nM PTC-028 for 48h, cells were subjected to the TUNEL assay and analyzed by fluorescence microscopy. The number of TUNEL positive nuclei were counted from ∼300 cells per treatment group. Data represent the mean ± S.D. of three independent experiments performed in triplicate. *P<0.05 when comparing with respective control by Student's t-test. (C) CP20 or OV90 cells were treated with 100 nM PTC-028 or 200 nM PTC-209 for 48h. Expression of BMI-1, RIPK1, XIAP, LC3B, cleaved caspase 7, cleaved caspase 9, PARP and beta actin was determined by immunoblotting. (D) CP20 cells were treated with PTC-028 at 100 nM or with PTC-209 at 200 nm for the indicated times. Expression of BMI-1, PARP and β-actin was determined by immunoblotting (left panel). The quantitation of basal, residual BMI-1 by NIH Image J is shown in the right panel. (E) OV90 cells were treated with PTC-028 at 100 nM or with PTC-209 at 200 nm for the indicated times. Expression of BMI-1, PARP and β-actin was determined by immunoblotting (left panel). NIH Image J quantitation of the basal, residual BMI-1 is shown in the right panel. Data represent mean ± S.D. of three independent experiments performed in triplicate. *P<0.05 when comparing between each group at respective time point by a two-way ANOVA.

