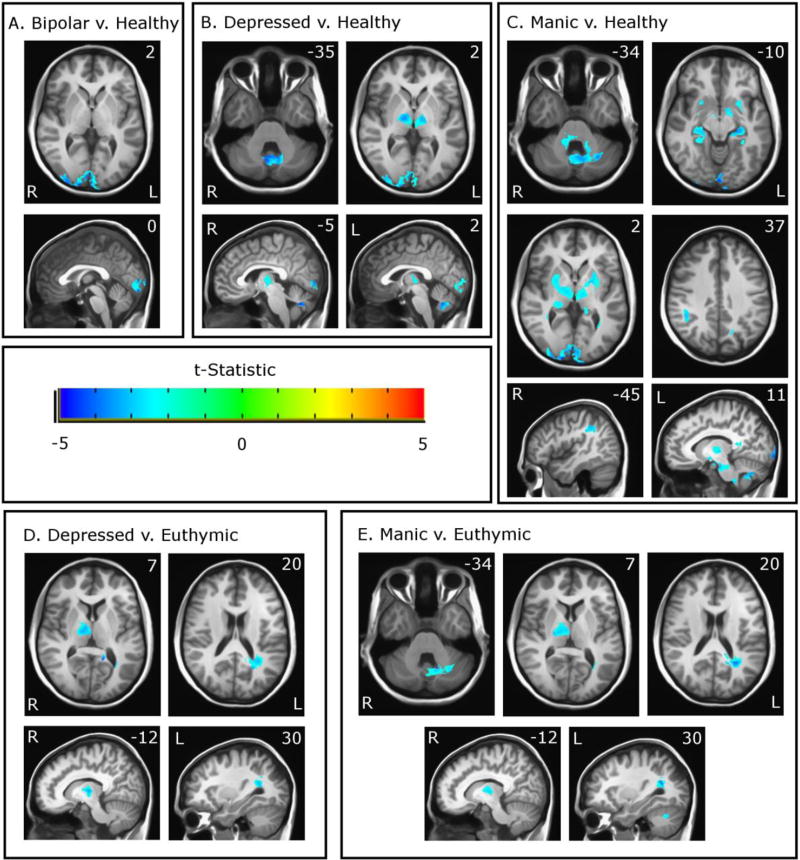
Figure 1.
Functional differences between the bipolar group and healthy controls (A), between the depressed group and healthy controls (B), between the manic group and healthy controls (C), between the depressed group and the euthymic group (D), and between the manic group and the euthymic group (E) overlaid on MNI space. Colors reflect t-statistic value as shown in color bar. Images are thresholded at p < 0.05 based on cluster-based family-wise error correction. Areas where Group 1 exhibit reduced activation compared to Group 2 are shown in blue.

