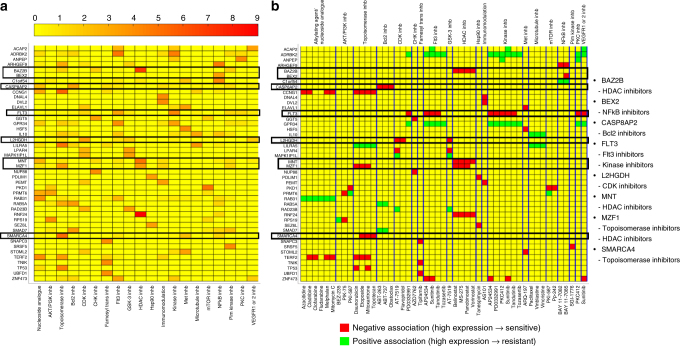
Fig. 6.
The 44 genes in total each of which was identified, by the MERGE approach, as being one of the top three important marker genes for a drug mechanism class. a A heat map that shows the level of specificity of each of the 44 genes (row) to each drug class (column) measured by −log10 (Fisherʹs exact test p-value). For clarity, we considered only Fisher’s exact test p-value <0.05 to be significant; other values are indicated in yellow. The drug classes that are not assigned by MERGE any genes with associations specific to the class and consistent in the cell line data are not shown. We highlighted the genes whose biological significance, we discussed in the Results section with black-colored boxes. b A heat map that shows the gene-drug association for genes and drug classes shown in a. Yellow indicates that the corresponding gene-drug pair does not have a statistically significant association (genome-wide FDR corrected p-values <0.1), while green indicates a positive and red a negative association. The drugs are grouped by blue lines based on their classes, and the class names for each group are written on top of the heat map. Drugs that are members of more than one drug class (e.g., sunitinib) are shown multiple times for each class to which the drug belongs. The list on the right shows the genes whose biological significance we discussed in the Results section, and the drug classes they are specific to

