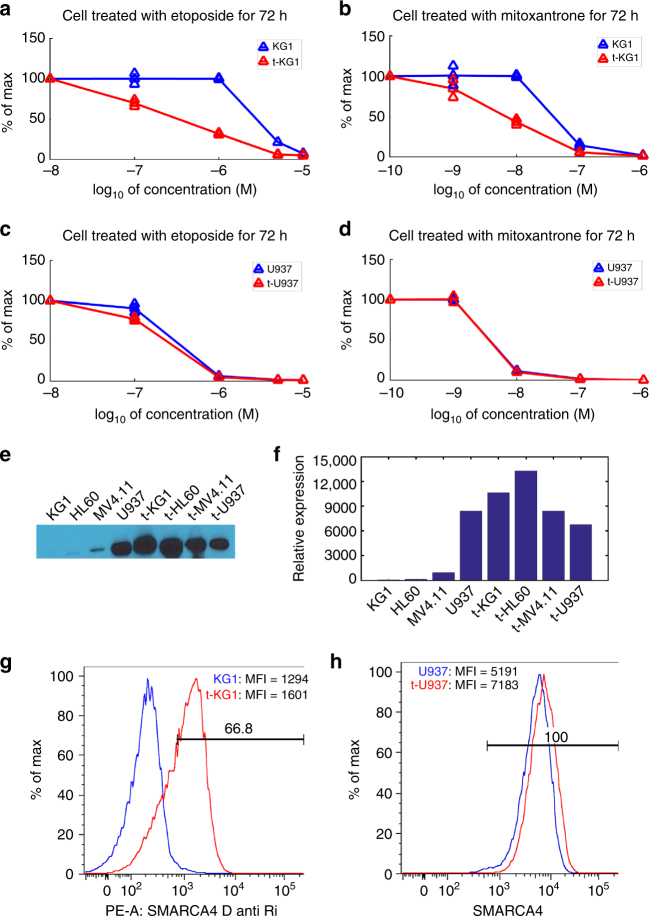
Fig. 7.
SMARCA4 plasmid transfection experiments on cell lines KG1 and U937 for comparison of response to etoposide and mitoxantrone between original and transfected cells. a, b Comparison of the 72-h dose-response curves between KG1 cells (blue) and transfected KG1 cells (red) when cells are treated with (a) etoposide, and (b) mitoxantrone. c, d Comparison of the dose-response curves between U937 cells (blue) and transfected U937 cells (red) when cells are treated with (c) etoposide and (d) mitoxantrone. Three triangular marks at each point on the line indicate individual data points in duplicates and the average among them. The line connects averages of duplicates in each concentration measured. e Representative cropped western blot of control and transfected AML cell lines: KG1, U937, HL60, and MV4.11. Uncropped version is shown in Supplementary Fig. 6. f Quantifications of the SMARCA4 protein expression pattern of each of AML cell lines in (e). g Flow cytometry of SMARCA4 surface expression data confirm the overexpression for KG1 (blue) vs. transfected KG1 (red). h Flow cytometry of SMARCA4 surface expression data for U937 (blue) vs. transfected U937 (red). We note that U937 already strongly expresses SMARCA4, while KG1 exhibits minimal expression until after transfection. Abbreviations in d and f are as follows: PE-A, P-phycoerythrin area; MFI, mean fluorescence intensity; D anti Ri, Donkey anti-Rabbit

