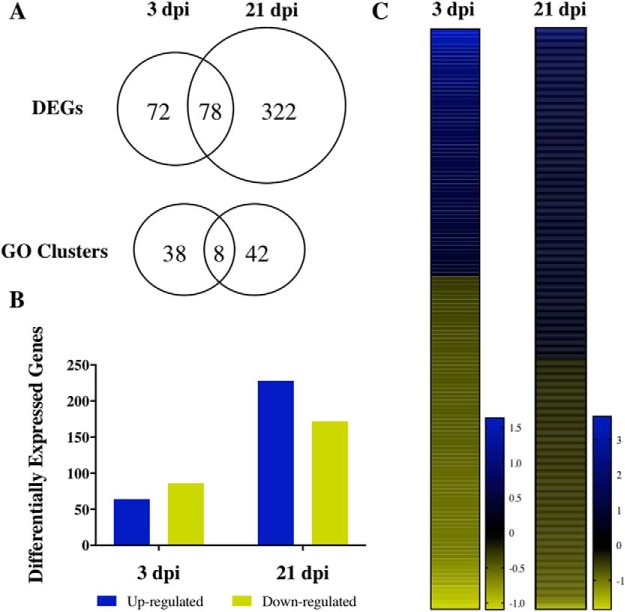
Figure 2.
Summary of differential gene analysis and GO enrichment results. The number of shared and mutually exclusive DEGs (A) and GO categories between 3 and 21 dpi (p < 0.05). The total number of up and down-regulated genes (B) and heat maps (C) showing log-2 fold change of gene expression in comparison to the control group.

