
Figure 7.
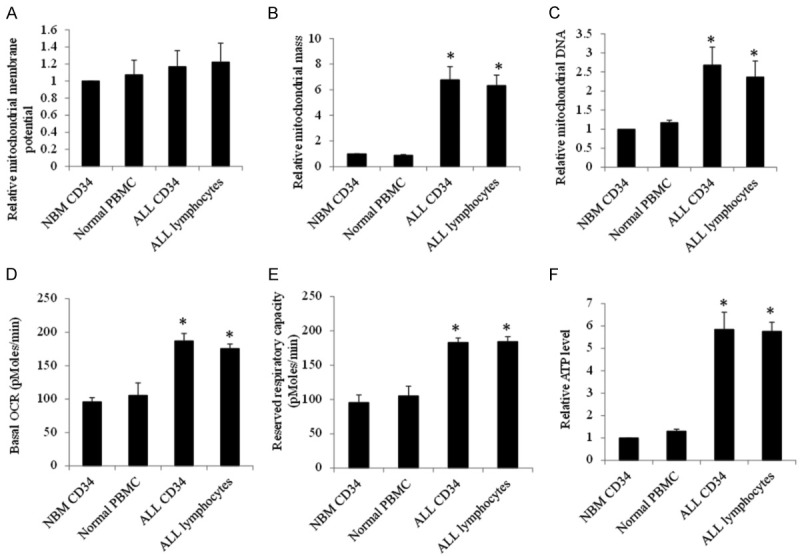
Mitochondrial characteristics of ALL and normal hematopoietic cells. Baseline mitochondrial membrane potential (A), mitochondrial mass (B) and DNA (C), basal (D) and maximal (E), and ATP levels (F) in NBM CD34, normal PBMC, ALL CD34 and ALL lymphocytes. n=5 for ALL and n=3 for normal. *P<0.05, compared to NBM CD34.