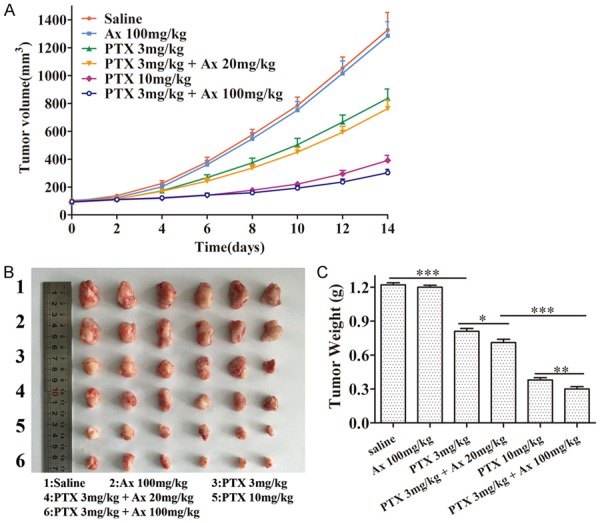
Figure 5.

In vivo anti-tumor effects of different treatment groups in A549 subcutaneous nude mice model. A. The changes of tumor volume of subcutaneous tumor-bearing nude mice at the indicated time. Mean ± SD, n = 6. B. Tumor morphology and size at the experimental end point (14th day). C. Tumor weight at the experimental end point (14th day). Mean ± SD, n = 6. *P < 0.05, **P < 0.01, ***P < 0.001.
