
Figure 2.
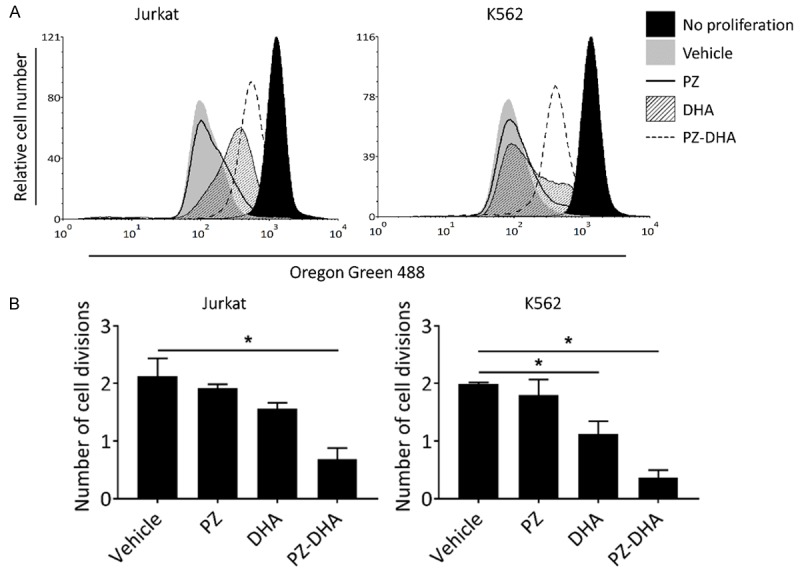
PZ-DHA suppresses leukemia cell proliferation. A. Oregon Green 488 fluorescent dye-stained Jurkat and K562 cells were treated with vehicle or test compounds (30 µM) for 72 h. Cells were then harvested and fluorescence intensity was quantified by flow cytometry relative to the non-proliferative control (baseline). Histograms from a representative experiment are shown. B. Bar graphs (derived from A show mean number of cell division in each treatment normalized to the non-proliferative control. Data represent mean ± SD (n=3). *P < 0.05, compared to vehicle control (ANOVA, Dunnett’s test).