
Figure 3.
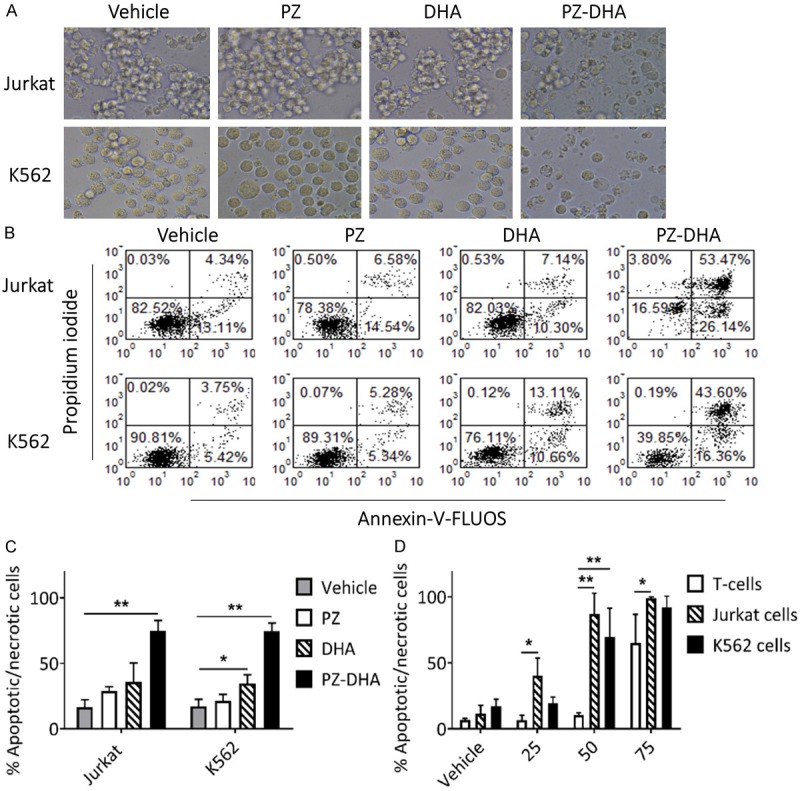
PZ-DHA induces apoptosis in leukemia cells while sparing normal murine T-cells. A. Jurkat and K562 cells were treated with vehicle or test compounds (50 µM) for 24 h and photographed using phase contrast microscopy at 400 × magnification. Photos are representative of three independent experiments. B. Flow cytometry analysis with Annexin V/PI dual staining was used to evaluate apoptosis induction in Jurkat and K562 cell lines treated with vehicle or test compounds (50 µM) for 24 h. Cytograms are representative of one of three independent experiments. C. Bar graphs (derived from A show % of apoptotic/necrotic (Annexin V, PI and Annexin V/PI positive) cells. D. Bar graphs showing % apoptotic/necrotic normal murine T-cells, Jurkat, and K562 cells treated with vehicle or test compounds at 25, 50, and 75 µM treatment doses. Data represent mean ± SD (n=3). *P < 0.05 and **P < 0.001, compared among means (ANOVA, Tukey’s test).