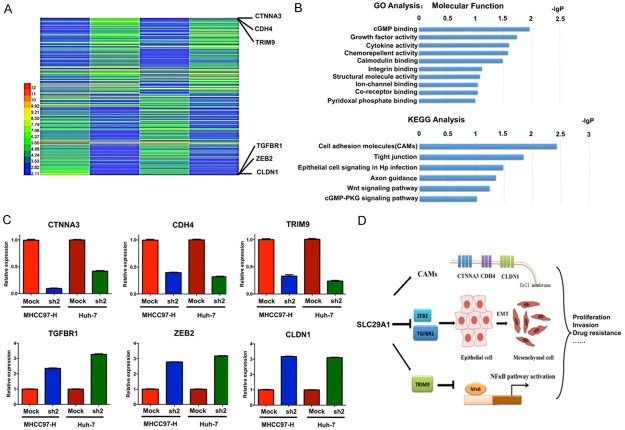
Figure 6.
Microarray-based gene expression profiles after SLC29A1 down-regulation. A. One hundred twelve genes were up-regulated (ratio > 2.0), and 123 genes were down-regulated (ratio < 0.5) between SLC29A1 shRNA-treated and Mock Huh-7/MHCC97-H cells. B. GO and KEGG analysis results. C. SLC29A1 expression was positively correlated with CAM and TRIM expression, thus increasing cell adhesion and inhibiting the NF-κB pathway, and negatively correlated with ZEB2 and TGFBR expression, thus inhibiting the epithelial-mesenchymal transition (EMT). D. Schematic diagram of the mechanisms of SLC29A1 involvement in hepatocellular carcinoma.

