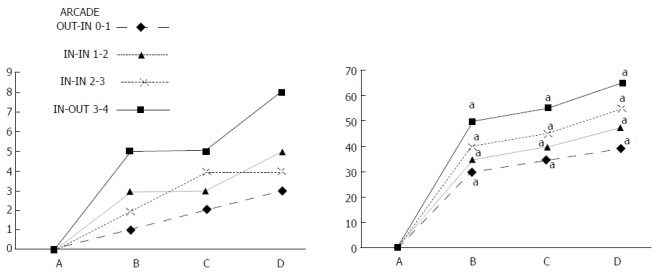
Figure 7.

IC + RL rats. Per cent of vessel presentation between arcade vessels, next to the previous proximal ligature (arcade 0), next to the previous distal ligature (arcade 4), and within the previous ligated area (arcade 1, 2, 3) on the dorsal side of the colon at 15 min after therapy (as 100%); mean ± SD. The gross appearance of the tissue was recorded using a USB microscope camera. The following time points were assessed: A: After ligation and before therapy (1 min); B: 5 min after the application of medication; C: Between 5 and 10 min after the application of medication; D: From 10 min after the application of medication until the end of the observation at 15 min. At 1 min post-injury, BPC 157 (10 μg /kg, 1 mL bath/rat) or an equal volume of a saline bath (controls) was applied to the reperfused 25-mm colon segment; the rats were sacrificed at 15 min. For clarity, the SD is not shown on the graph; the SD was never higher than 10% of the mean. aP < 0.05 at least vs control.
