. 2017 Dec;61(12):990–995. doi: 10.4103/ija.IJA_352_17
Copyright: © 2017 Indian Journal of Anaesthesia
This is an open access article distributed under the terms of the Creative Commons Attribution-NonCommercial-ShareAlike 3.0 License, which allows others to remix, tweak, and build upon the work non-commercially, as long as the author is credited and the new creations are licensed under the identical terms.
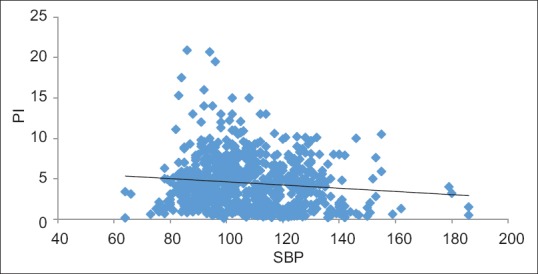
Figure 2.

Scatter plot between perfusion index and systolic blood pressure
