Figure 1.

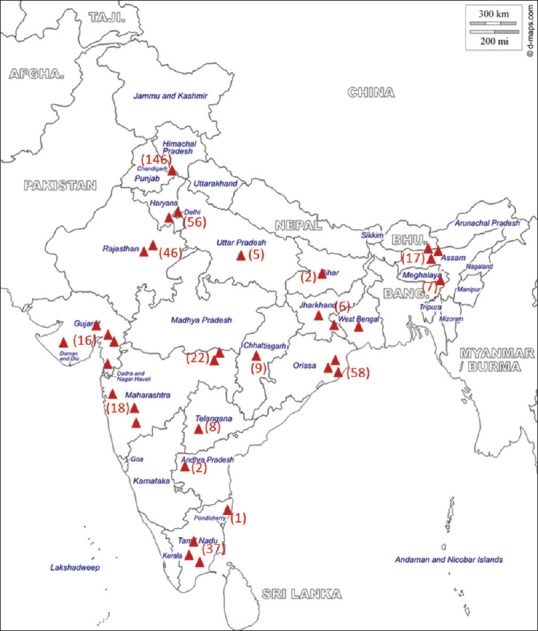
Map of India showing the distribution of study sites and participants.  Denotes individual recruitment center. The number of participants from each site/region is given in parenthesis

Map of India showing the distribution of study sites and participants.  Denotes individual recruitment center. The number of participants from each site/region is given in parenthesis