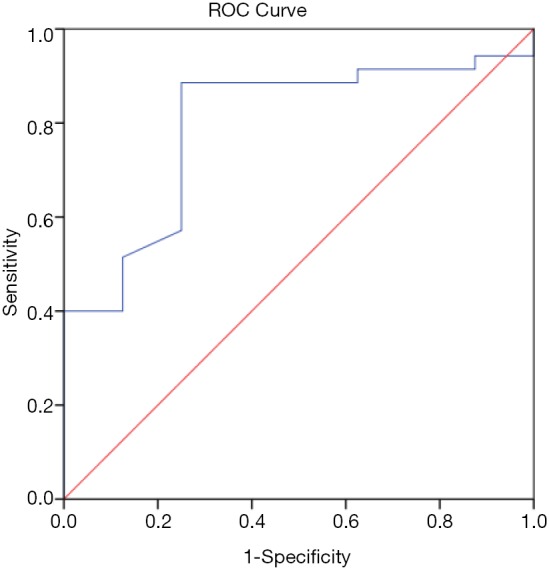
Figure 1.

ROC curve analysis for highest quartile of Lp-PLA2 concentration and coronary artery disease. ROC curve analysis for utility of Lp-PLA2 concentration (highest quartile) in its ability to discriminate subjects with coronary artery disease from normal healthy controls (AUC 0.80, 95% CI, 0.65–0.9; P<0.001). Cut off value for Lp-PLA2 concentration of >427 ng/mL was found to have the optimum balance of sensitivity (88.6%) and specificity (75%). ROC, receiver operating characteristic; AUC, area under curve.
