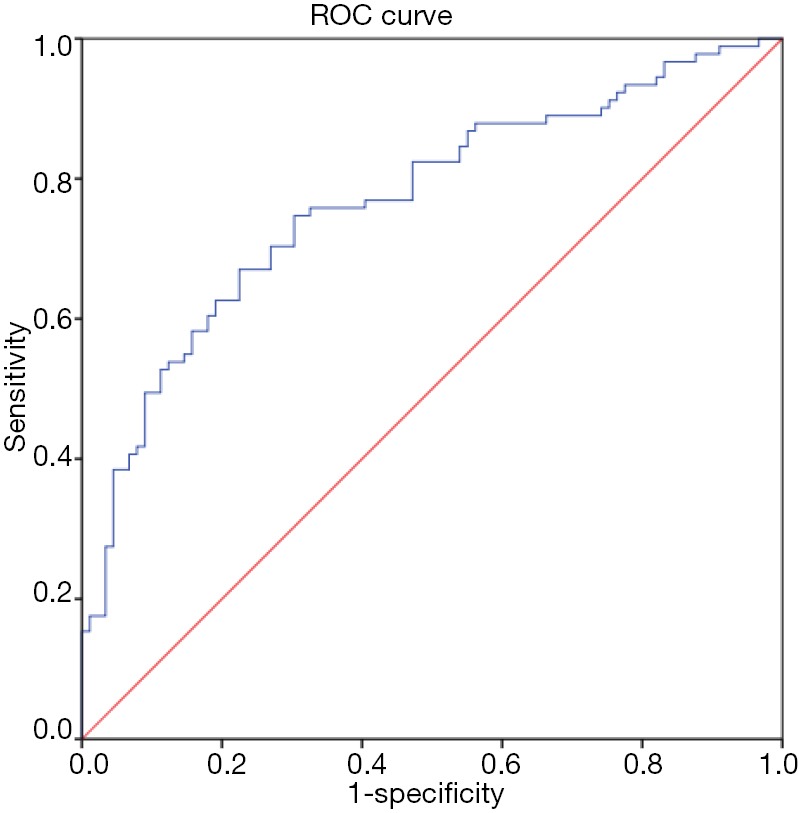
Figure 2.

ROC curve analysis for ApoA1 and coronary artery disease. ROC curve analysis for utility of ApoA1 in its ability to discriminate subjects with coronary artery disease from normal healthy controls (AUC 0.78; 95% CI, 0.70–0.85; P<0.001). Cut off value for ApoA1 of ≤129.6 mg/dL was found to have the optimum balance of sensitivity (78.2%) and specificity (68.3%). ROC, receiver operating characteristic; AUC,area under curve.
