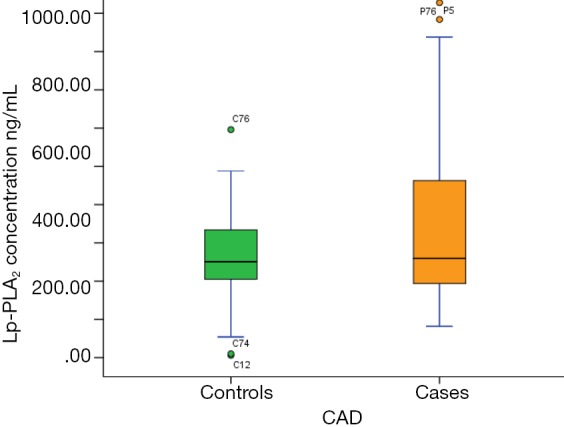
Figure 3.

Lp-PLA2 levels in CAD group vs. control group. Comparison of Lp-PLA2 levels in CAD group (median, 253 ng/mL; 95% CI for mean, 193–444 ng/mL) vs. controls group (median, 246 ng/mL; 95% CI for mean 193–333 ng/mL) (P=0.05). The circles ‘o’ represent outliers and the color represent the cases or controls. CAD, coronary artery disease.
