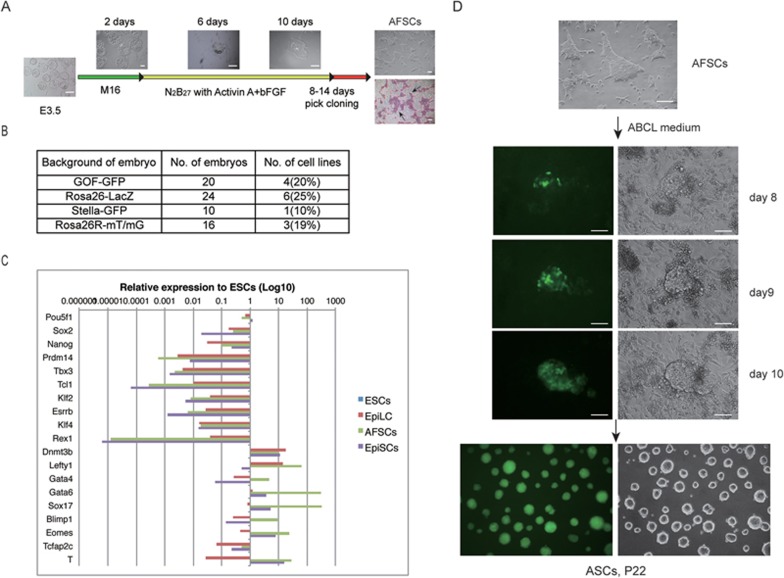
Figure 1.
Derivation of AFSCs and ASCs. (A) Schematic overview of AFSC derivation. Note AP-positive cells (arrow indicated) in AFSCs. Scale bars, 100 μm. (B) Derivation rate of AFSCs with diverse genetic backgrounds. (C) Quantitative RT-PCR of key genes in ESCs, EpiLCs, AFSCs and EpiSCs, all derived from 129/sv females mated with GOF-GFP males of mixed background. Note the expression of endoderm and mesoderm genes in AFSCs (at the bottom). (D) Reprogramming AFSC to ASCs. Scale bars, 100 μm.

