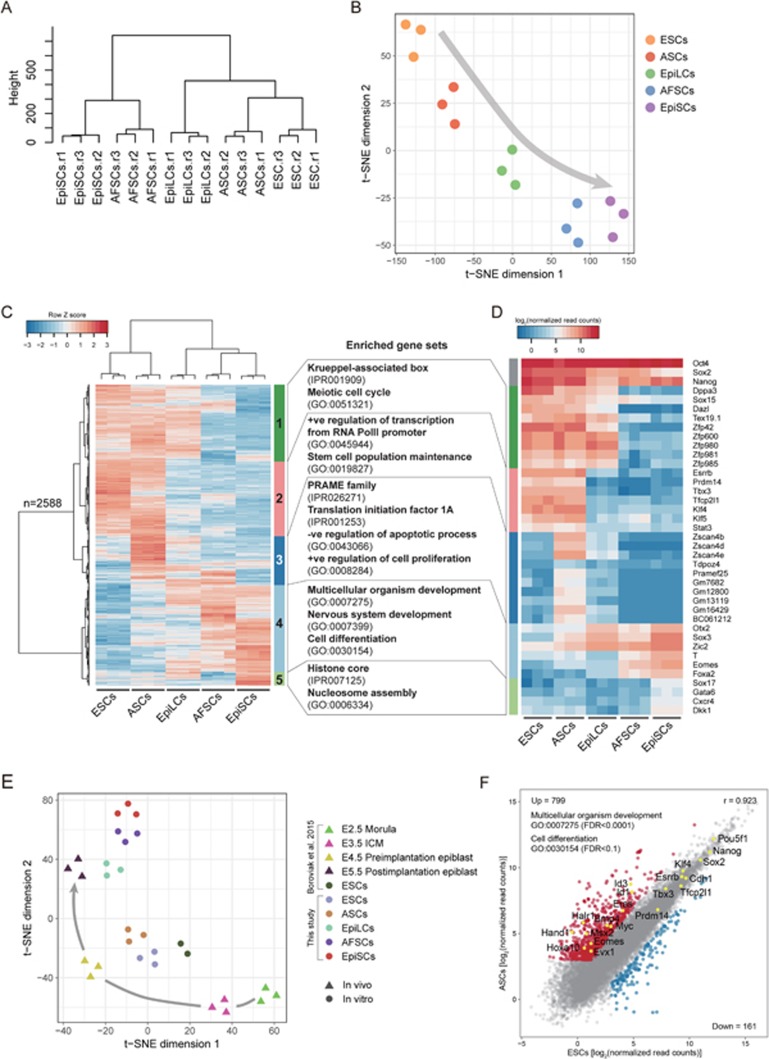
Figure 3.
RNA-seq analysis of AFSCs and ASCs. (A) Unsupervised hierarchical clustering (UHC) of whole-genome transcriptome from three biological replicates. Note that ASCs were clustered close to ESCs but not EpiSCs. (B) t-distributed stochastic neighbor embedding (t-SNE) of whole-genome transcriptome. Arrow represents potential trajectory from naive to primed pluripotent stem cells. (C) Heatmap showing scaled expression values of 2 588 differentially expressed genes (mean log2(normalized read counts) > 3 in any sample, log2(fold change) > 3, adjusted P-value < 0.05) between the five cell types. UHC of five major gene clusters. The top representative GO biological process and InterPro terms for each cluster are indicated on the right. (D) Expression heatmap of representative genes for each cluster in C. (E) t-SNE analysis of gene expression of pluripotent stem cells, and of E2.5-E5.5 embryos25, based on 1 685 dynamically expressed genes25. Arrow indicates developmental progression from E2.5 morula to E5.5 postimplantation epiblast. (F) Pair-wise gene expression comparison between ASCs and ESCs (2i/LIF). Upregulated (red) and downregulated (blue) genes in ASCs were highlighted (mean log2(normalized read counts) > 3 in either samples, log2(fold change) > 2, adjusted P-value < 0.05). Gene ontology analysis (by DAVID) showed ASCs upregulated genes that are involved in multicellular organism development and cell differentiation.

