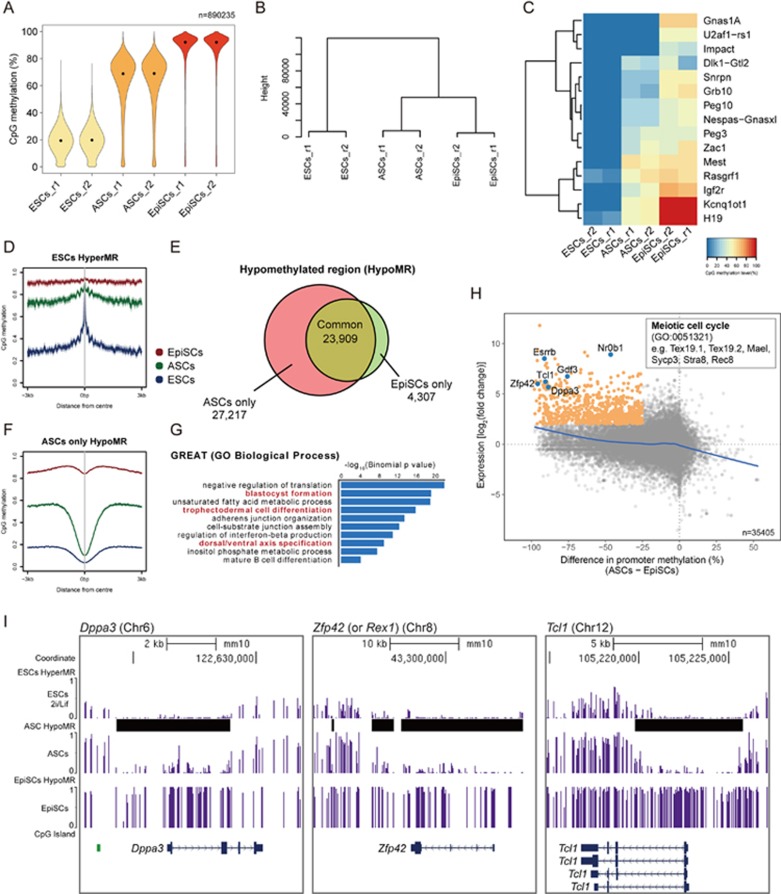
Figure 4.
Methylation analysis of ASCs. (A) Violin plot showing CpG methylation distribution of 2 kilobase (kb) genomic tiles. (B) UHC of methylation levels of 2 kb genomic tiles. (C) Heatmap showing CpG methylation of imprint control regions (ICRs) in ESCs, ASCs and EpiSCs. (D) Methylation profiles of ESCs hypermethylated regions (HyperMR) in ESCs. Note that HyperMR in ESCs were generally hypermethylated in ASCs and EpiSCs. (E) Venn diagram showing overlap of hypomethylated regions (HypoMR) between ASCs and EpiSCs. (F) Methylation profile of ASC-specific HypoMRs in E. (G) GREAT analysis of ASC-specific HypoMRs. (H) Scatterplot of differential gene expression and difference in promoter methylation between ASCs and EpiSCs. Genes with > 20% promoter methylation and log2 (read counts) > 3 in either samples were shown. Genes upregulated in ASCs with promoter demethylation are highlighted in orange. They were enriched for regulating meiotic cell cycle and cell pluripotency. Best fit curve (blue line) was generated by the generalized additive models (GAM). (I) UCSC genome browser snapshots of CpG methylation level at representative naive pluripotency genes.

