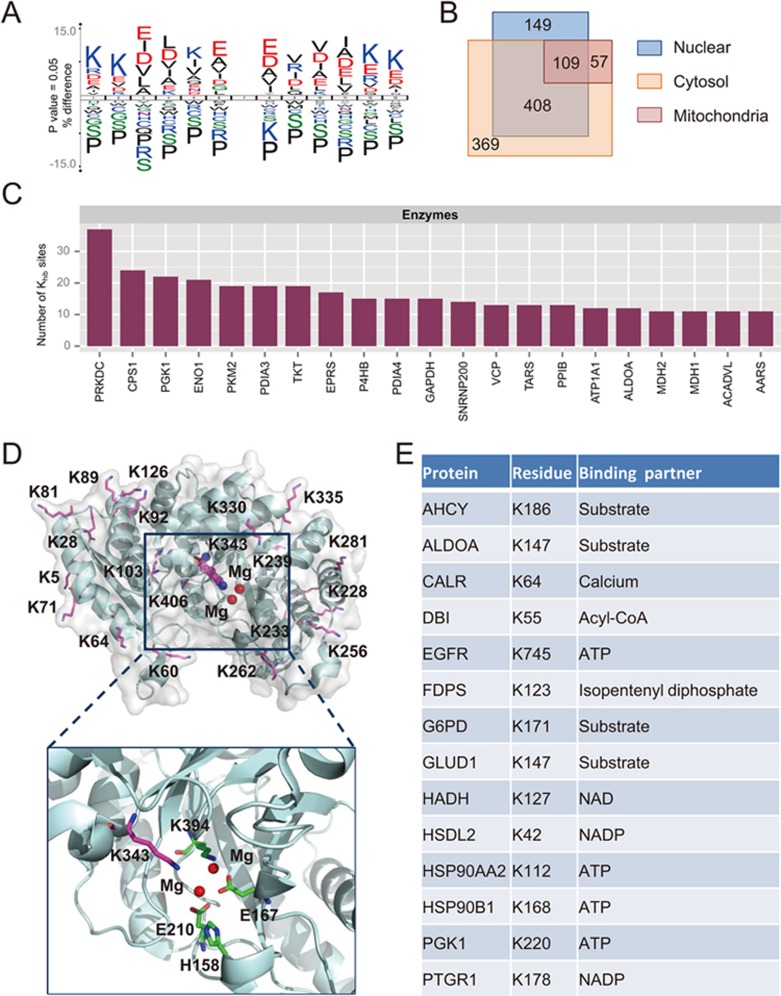
Figure 5.
Characterization of lysine 2-hydroxyisobutyrylation proteome in HeLa cells. (A) Consensus sequence logo shows a representative sequence for all Khib sites. (B) Venn diagram shows cellular compartment distribution of 2-hydroxyisobutyrylated proteins. (C) Distribution of the number of Khib sites on diverse enzymes. The enzymes with < 10 Khib sites are not shown in this bar graph. (D) Three-dimensional structure of alpha-enolase (ENO1, PDB entry 2PSN) shown with Khib sites. The important residues in the substrate binding pocked are shown in detail. (E) Table of the Khib sites on key residues involving substrate or cofactor binding.

