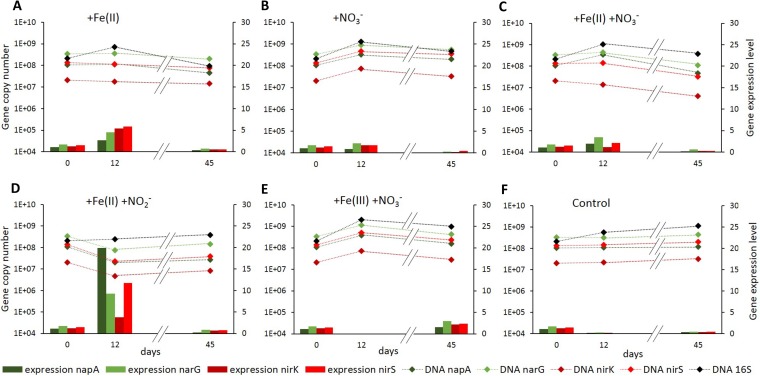
FIG 6.
Gene abundances (diamond symbols) of genes encoding nitrate (napA and narG) and nitrite reductases (nirK and nirS) and bacterial 16S rRNA and expression levels, i.e., cDNA/DNA ratios (bars) of the nitrate- and nitrite-reductase-encoding genes over time in different microcosm setups over time. On day 12 the extracted RNA levels for setups amended with Fe(III) and nitrate were too low for further processing and quantification.

