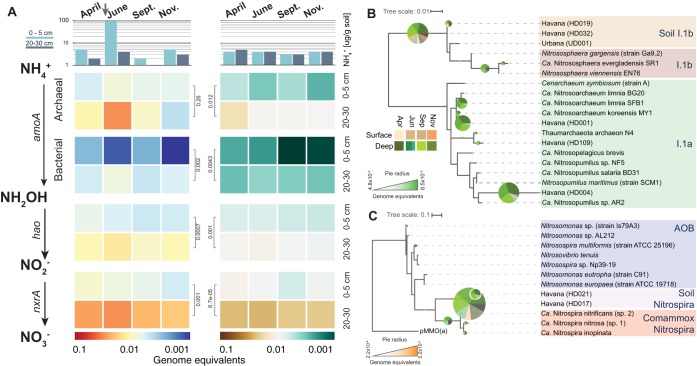
FIG 2.
Abundance and diversity of nitrification genes in sandy (Havana) and silt loam (Urbana) soils. (A) The top shows the concentration of NH4+ at both sites and depths. The arrow shows the point in time when N fertilizer (UAN28, 180 lb N/acre) was applied to the Havana site. Heatmaps represent calculated relative abundances of nitrification genes (genome equivalents) for Havana (left) and Urbana (right) soil samples. Values for the 20- to 30-cm layer in June represent the averages of the three soil cores. Gene abundance comparisons between soil layers were performed using two-sided t tests, and P values are shown in black, to the side of the heatmaps. Right panels show the phylogenetic reconstruction of archaeal (B) and bacterial (C) AmoA protein sequences recovered from contigs. Names in parentheses indicate the corresponding MAGs. Both trees include reference protein sequences and assembled sequences from both soil metagenomes. The pie charts represent the placing of Havana metagenomic reads for archaeal and bacterial amoA genes using RAxML EPA. Pie chart radii represent the read abundances for each node (calculated as genome equivalents), and the colors of the slices represent the depths and months the metagenomic reads originated from.

