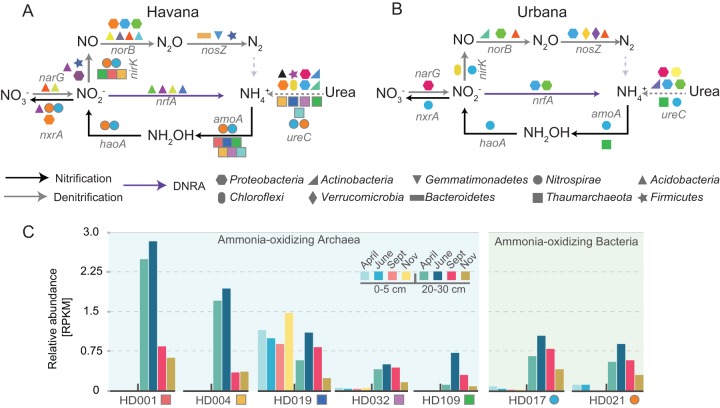
FIG 3.
Nitrogen cycle genes present in selected metagenome-assembled genomes and population abundance dynamics during the year in Havana. (A and B) MAGs obtained from Havana (A) and Urbana (B) were queried for the presence of N cycle gene markers using HMM models. Colors represent individual MAGs and the shapes depict the predicted taxonomies at the phylum level. Arrows show predicted N cycle pathways. (C) Bar plots show the relative abundances (y axis, reads per kilobase per million reads [RPKM]) for nitrifier MAGs (x axis) obtained from Havana soil metagenomes. Bright colors represent samples from the 0- to 5-cm soil layer, whereas darker color equivalents correspond to samples from the 20- to 30-cm layer (see figure key).

