
Figure 4.
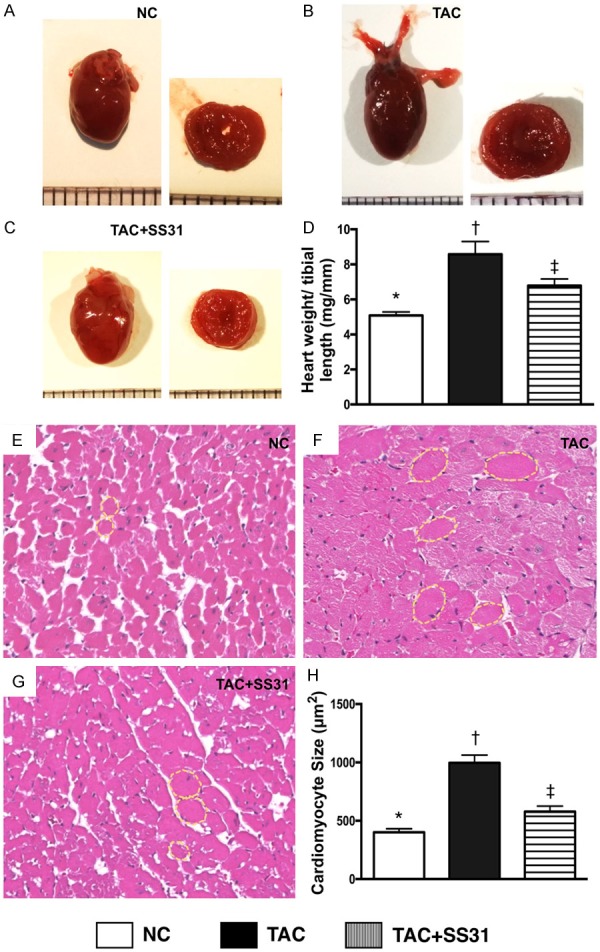
SS31 Treatment attenuated the anatomical and pathological findings of LV hypertrophic cardiomyopathy by day 60 after TAC procedure. A-C. Illustrating gross anatomical findings of the whole heart by day 60 after TAC procedure. Notably, as compared with NC, the whole heart was notably larger in TAC only animals. However, the heart size was notably smaller in TAC animals post SS31 treatment. D. Analytical result of the ratio of total heart weight to tibial length, * vs. other groups with different symbols (†, ‡), P<0.001. E-G. Illustrating H.E. microscopy (400×) for identification of cardiomyocyte size (yellow dotted line). Scale bars in right lower corner represent 50 µm. H. Analytical result of cardiomyocyte size, * vs. other groups with different symbols (†, ‡), P<0.0001. All statistical analyses were performed by one-way ANOVA, followed by Bonferroni multiple comparison post hoc test (n=6 for each group). Symbols (*, †, ‡) indicate significance at the 0.05 level. NC = normal control; TAC = transverse aortic constriction; LV = left ventricular.