
Figure 5.
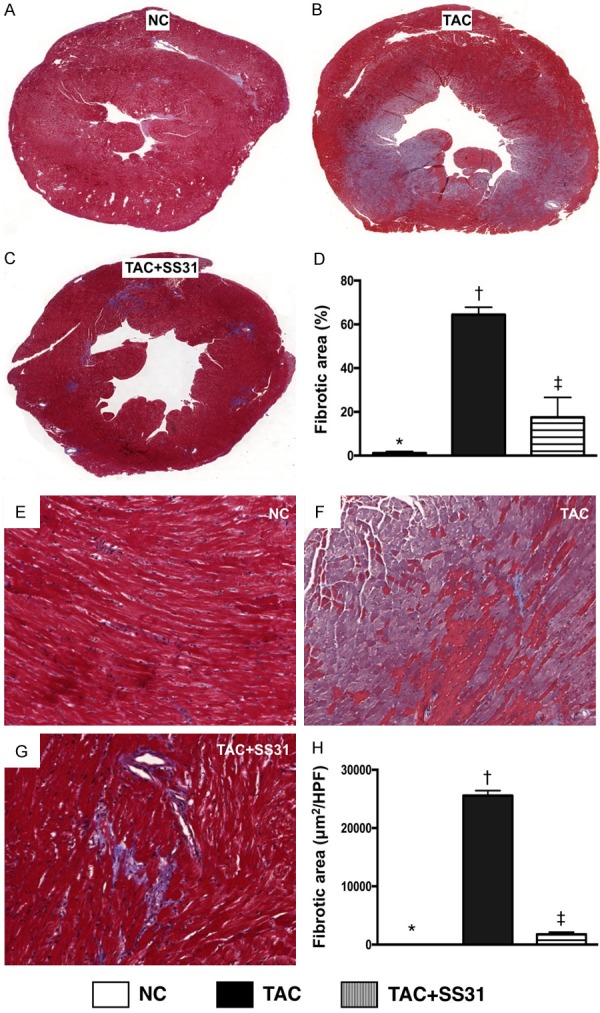
SS31 treatment suppressed the generation of fibrosis by day 60 after TAC procedure. A-C. Masson’s trichrome stain microscopy to identify LV fibrotic area (blue) in whole heart cross section (n=6). D. Analytical result of LV fibrosis area (%), * vs. other groups with different symbols (†, ‡), P<0.0001. E-G. Masson’s trichrome stain microscopy (100×) to identify left ventricular (LV) fibrosis area (blue) through randomized observation sliced LV myocardium (n=6). H. Analytical result of LV fibrosis area (μm2/HPF), * vs. other groups with different symbols (†, ‡), P<0.0001. Scale bars in right lower corner represent 100 µm. All statistical analyses were performed by one-way ANOVA, followed by Bonferroni multiple comparison post hoc test. Symbols (*, †, ‡) indicate significance at the 0.05 level. NC = normal control; TAC = transverse aortic constriction; LV = left ventricular; HPF = high-power field.