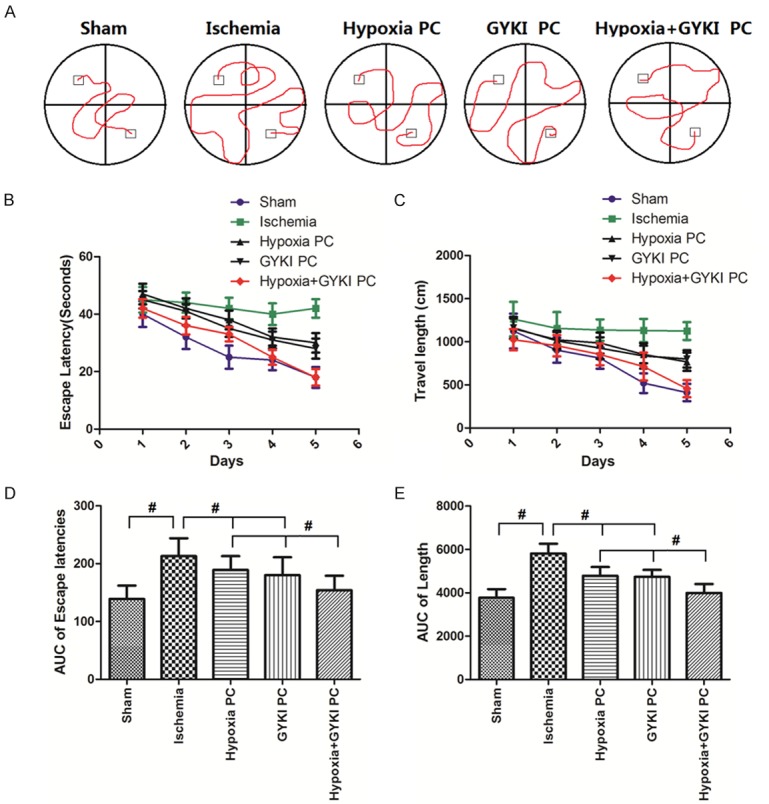
Figure 4.

Changes in escape latency and travel length in Morris water maze. (A) Shows the representive traces of rats traveled in different groups. (B) Shows the trends of escape latency in Morris water maze study and (D) demonstrates the area under the curve (AUC) calculated from (B). (C) Shows the trends of travel length and (E) demonstrates the AUC calculated from (C). Escape latency andtravel length was significantly increased in Ischemia group, but decreased by hypoxia PC or GYKI PC. Hypoxia+GYKI PC decreased it to a significantly lower level. PC: preconditioning; GYKI: GYKI-52466. #: p<0.05. N=10 per group.
