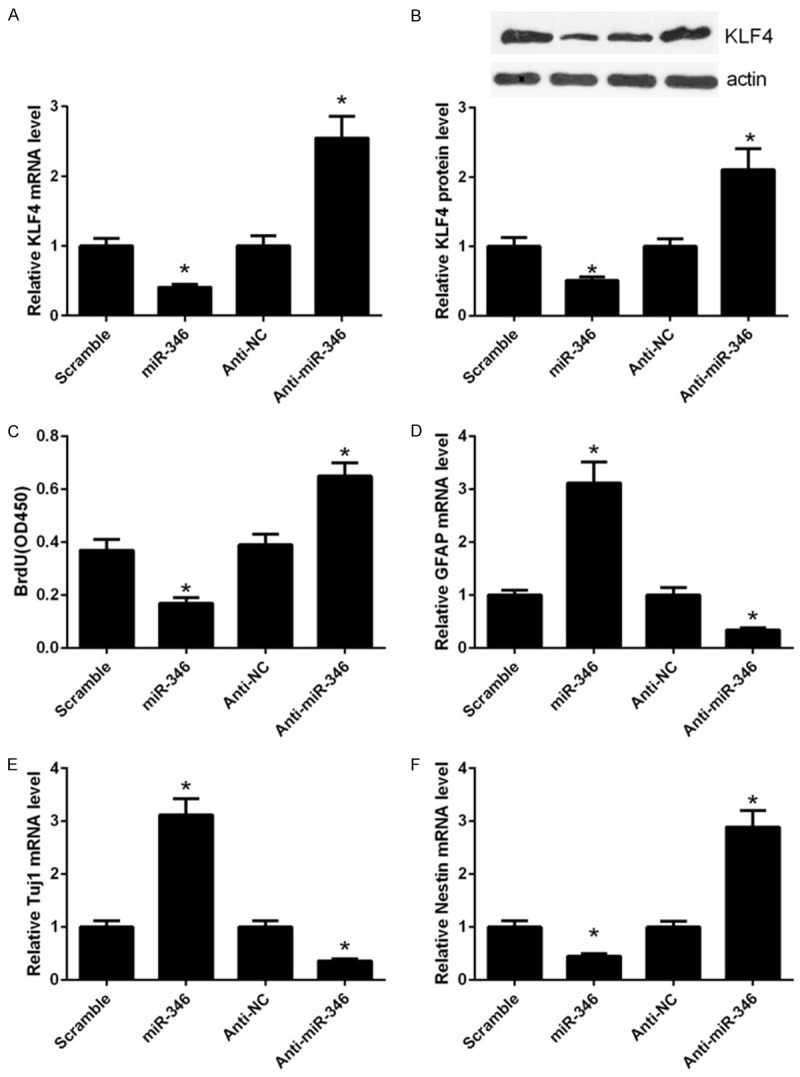
Figure 2.

miR-346 regulates KLF4 expression and NSC proliferation and differentiation. (A) qPCR analysis of KLF4 mRNA expression in NSCs transfected with the miR-346 mimics or antimiR-346. (B) Western blot analysis of KLF4 protein expression in NSCs transfected with the miR-346 mimics or anti-miR-346. The relative protein expression of KLF4 was quantified using Image-Pro Plus 6.0. After transfection for 48 h, cells were harvested for analysis. *p < 0.05 vs. miR-NC, &p < 0.05 vs. anti-miR-NC. (C) Proliferation of NSCs was detected by the BrdU assay. NSCs were transfected with the miR-346 mimics or anti-miR-346 for 48 h followed by detection with BrdU assay. (D) qPCR analysis of GFAP expression in NSCs. NSCs were transfected with the miR-346 mimics or anti-miR-346 in the presence with 5 mM forskolin and 0.5% FBS and cultured for 3 days. (E) qPCR analysis of Tuj1 expression in NSCs transfected with the miR-346 mimics or anti-miR-346 in the presence with 1 mM retinoic acid and 0.5% FBS for 3 days. (F) qPCR analysis of Nestin expression in NSCs transfected with the miR-346 mimics or anti-miR-346. Cells were cultured in the maintaining medium for 3 days before analysis. *p < 0.05 vs. miR-NC, &p < 0.05 vs. anti-343 miR-NC. Data were shown as means ± standard deviation (SD) and were processed by one-way ANOVA analysis. All experiments were repeated at least three times independently.
