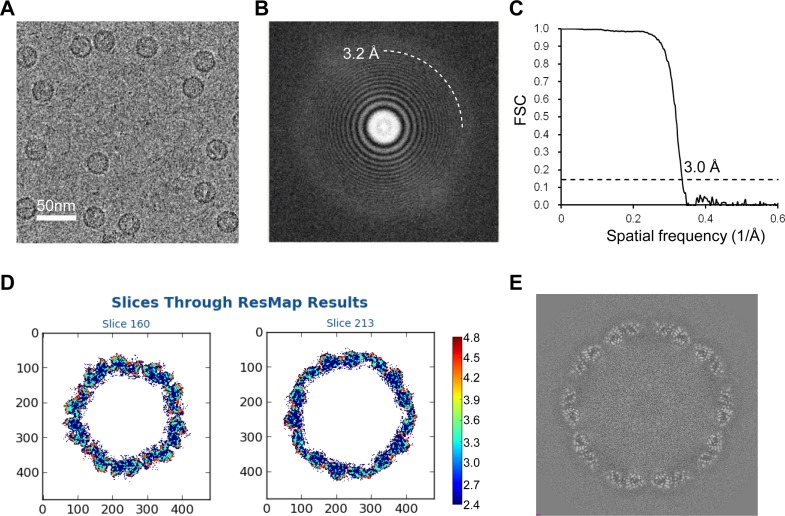
FIG 1.
Cryo-EM image of CVA6 VLP and resolution evaluation of the cryo-EM map. (A) A representative cryo-EM image of the CVA6 VLP. Bar, 50 nm. (B) Power spectrum of the micrograph shown in panel A. The white dashed curve indicates that the image contains a signal at 3.2-Å resolution. (C) Resolution assessment of the cryo-EM reconstruction by Fourier shell correlation (FSC) at a criterion of 0.143. (D) Local resolution evaluation of the cryo-EM map by ResMap. The resolution color bar (in angstroms) is also labeled. (E) Central section of the cryo-EM map visualized along the 5-fold symmetry axis.

